Adaptive Architecture and Resilience
A digital tool to present adaptive architecture ideas in the form of responsive visualization.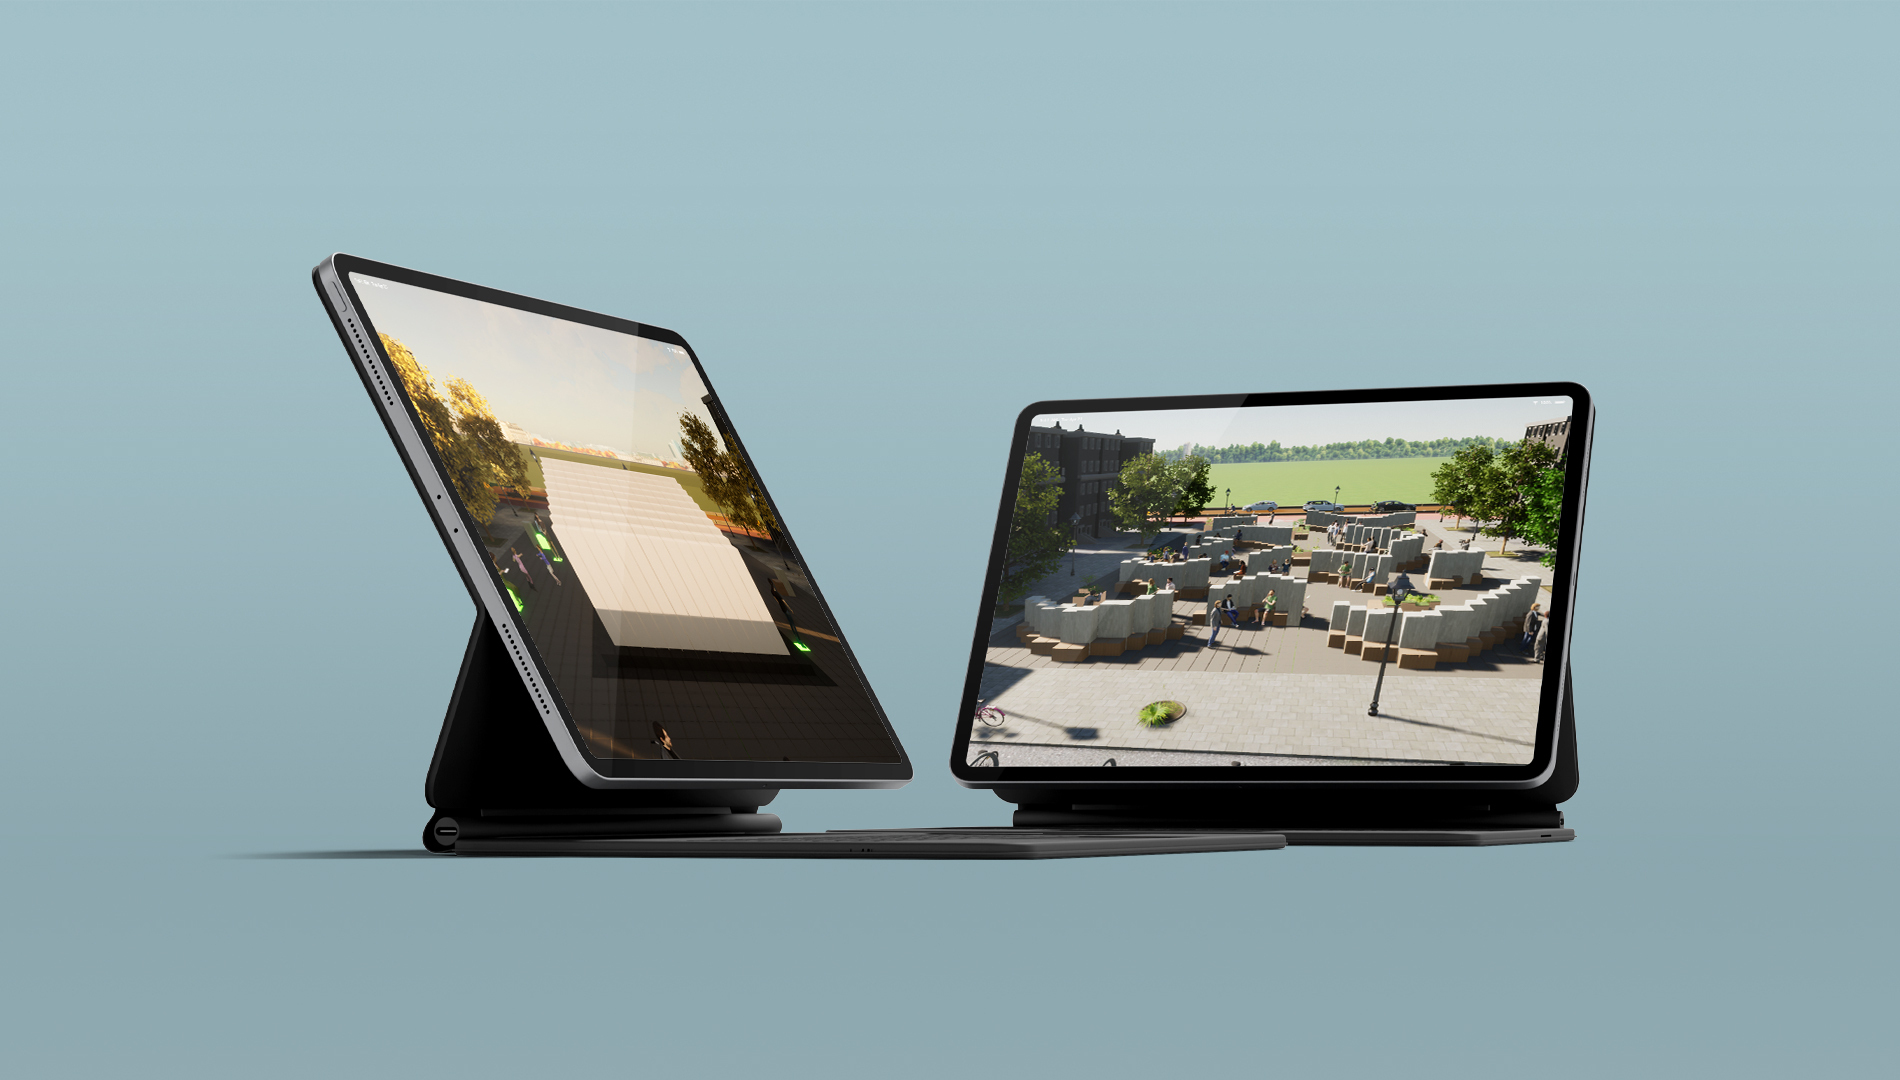
-
Client:
Lectoraat Civic Interaction Design
- Team:
-
Disciplines:
Speculative Design, Interaction Design, 3D
-
Schoolyear:
2021-2022
When the COVID-19 epidemic struck two years ago, our lives and our environment were impacted in several ways, most especially socially. How could architecture design adaptive spaces to cater for future global crises? As part of the Lectoraat Civic Interaction Design AUAS research project "From Prevention to Resilience," which looked at how Covid-19 interventions may make neighbourhoods more resilient. In our project, we were tasked with looking into the potential role of adaptive architecture in designing resilient public spaces in neighbourhoods so it can withstand current and future global crises.
First, we turned the brief into a digital design project and debriefed the brief to come up with our design problem. How might we help architects show people their ideas for resilient adaptive architecture in public spaces through a responsive visualization?
Scenarios selection
The first scenario, resilience to pandemic, was given by the client. We began brainstorming on the second scenario by looking at different crisis scenarios. We used desk research to find out the different kinds of crises that the Netherlands has experienced and analysed the possibility of reoccurrence. The strongest idea in this category was ‘resilience to flooding and ‘wind’. We also analysed present environmental hazards and ‘resilience to air pollution’ topped the list. The challenging task was to select and work on one of the scenarios. Looking at the brief we have, and the condition of success given to us by the client, ‘resilience to wind’ to chosen to work on.
Ideation
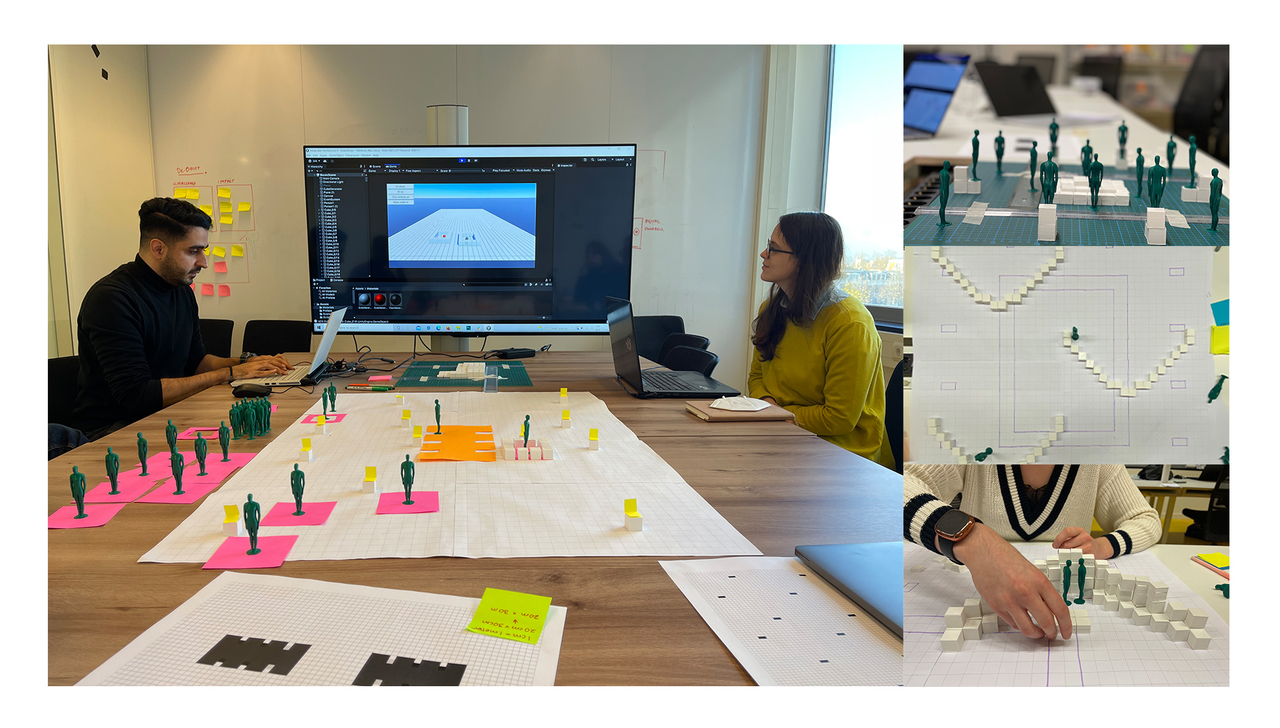
As designers working on an architectural project, we started lo-fi ideation with pen and paper sketching different positioning of the tiles with the active/passive interaction between the architectural element(s) and user(s). To bring them alive we printed the public square of 20m by 30m with a 2400 tile grid on an A2 sheet, 3D printed 50cm sized cubes and a 150cm human model. With these paper and 3D model prototypes we visualized and tested 1.5m social distancing and data visualization for hospitalized cases. In the wind scenario, we tested the strength of the wind that will trigger the tile’s movement and the formation of tiles.
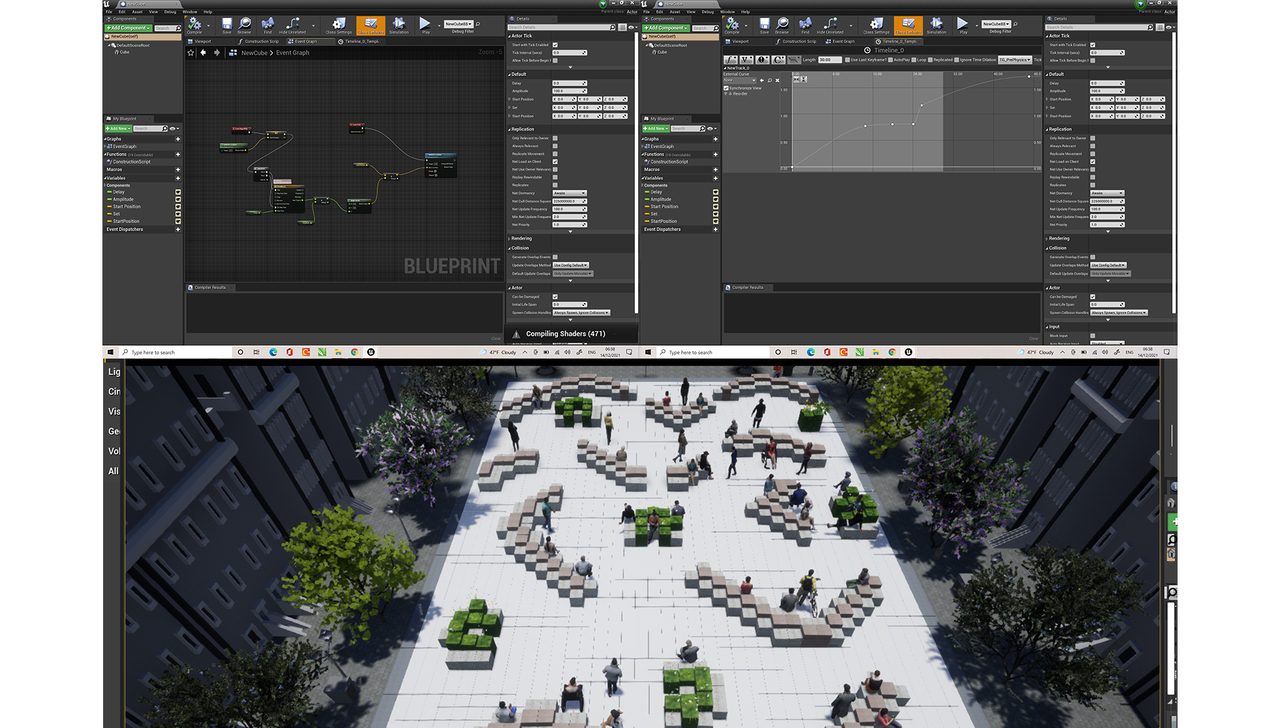
Digital technology
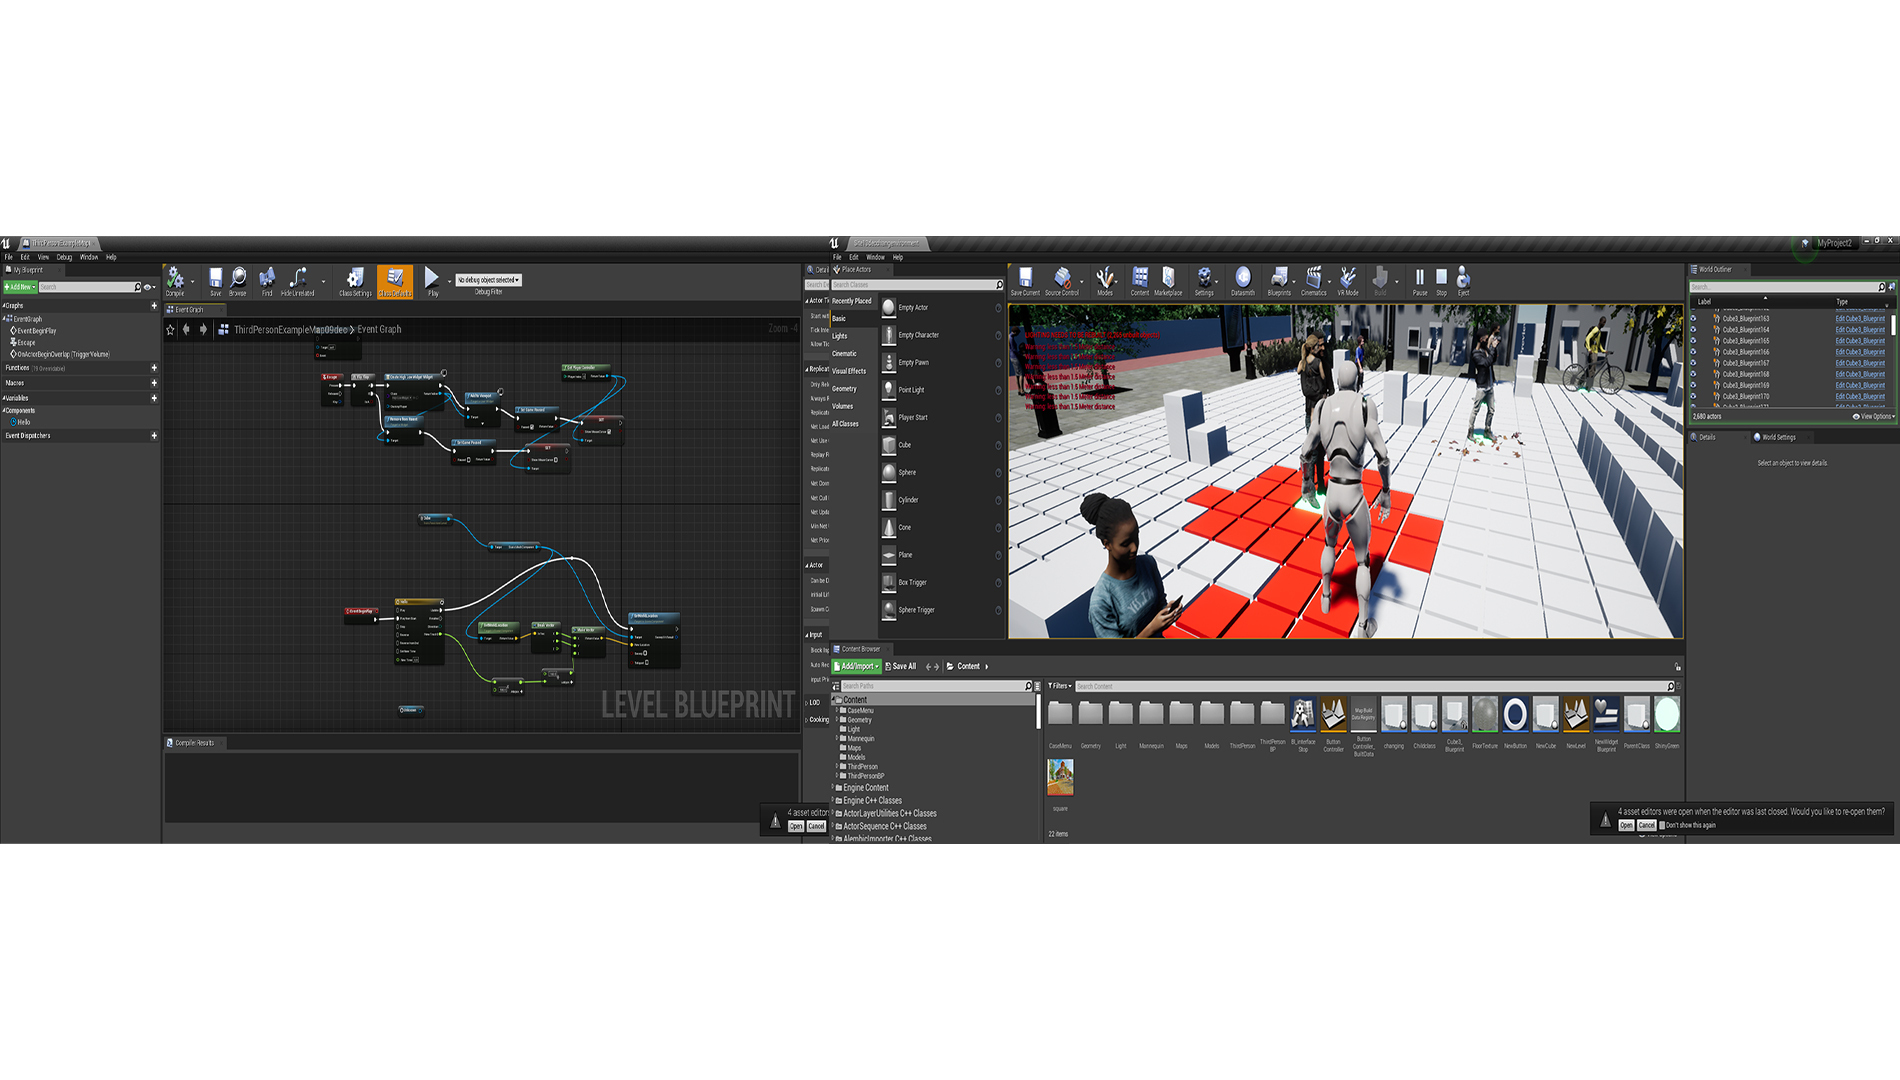
As a team with no programming experience, our first challenge was to translate our tested physical prototype to digital. Our client recommended Unity for the 3D interaction, however, that meant we had to learn c# in four weeks, not forgetting lots of testing and iterations which was nearly impossible. We tried Unity out by creating an interactive game with the circle and cubes which represented humans and tiles, respectively. To meet the deadline, we switched to Unreal Engine which uses a blueprint.
We divided our deliverable into aesthetic 3D visualization and 3D interactive visualization. For the aesthetic 3D visualization, we used Twinmotion a sister software to Unreal Engine. The output is exported directly to Oculus for testing. Unreal Engine was used for the 3D interactive visualization, and Oculus feedback was incorporated.
Resilience to pandemic
We focused on the present pandemic, in which people are required to maintain 1.5 meters social distance from each other. When that distance is not maintained, the public square responds with lights and movement, and the installation at the center of the square stops moving. The height of the installation visualized the data of hospitalization. This data will be gotten from The National Institute for Public Health and the Environment (RIVM)
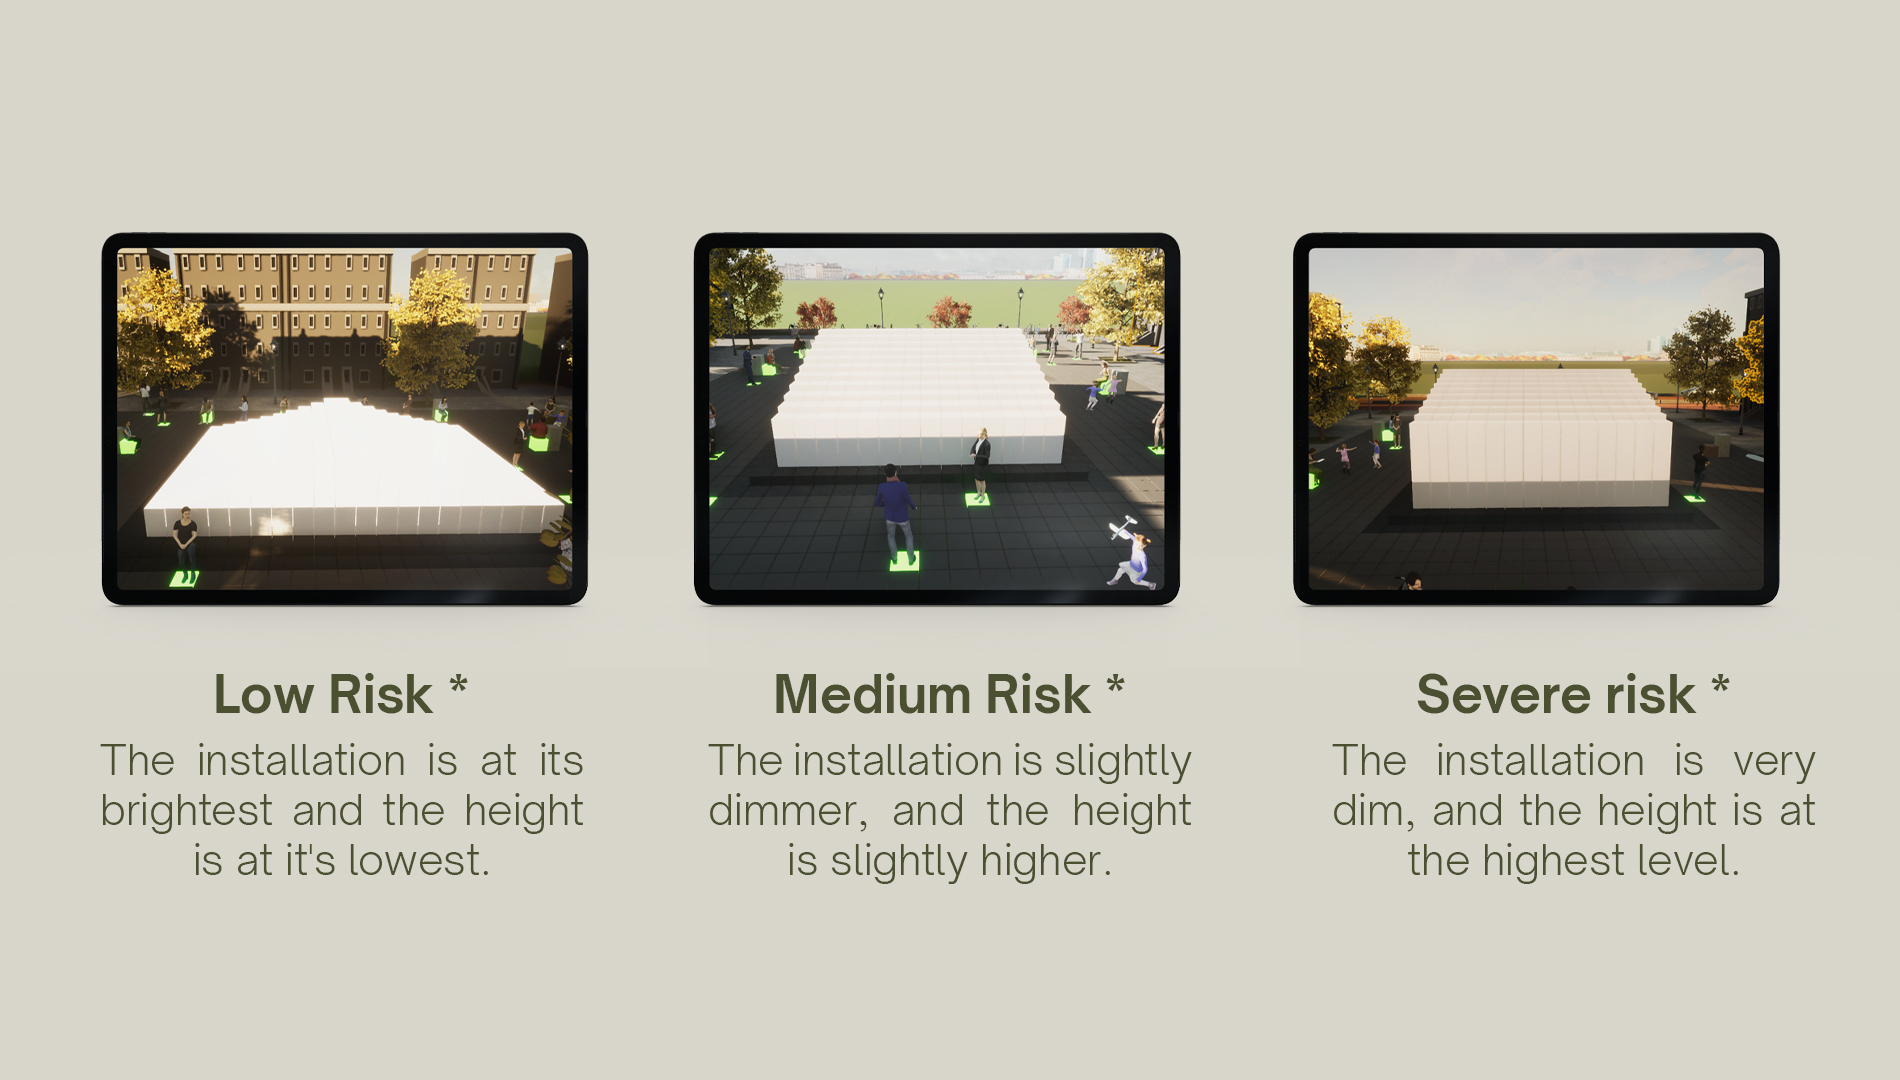
Resilience to wind
For the second scenario, we created a public square that provides cover from the high winds in the Netherland. This data will be gotten from The Royal Netherlands Meteorological Institute (KNMI).
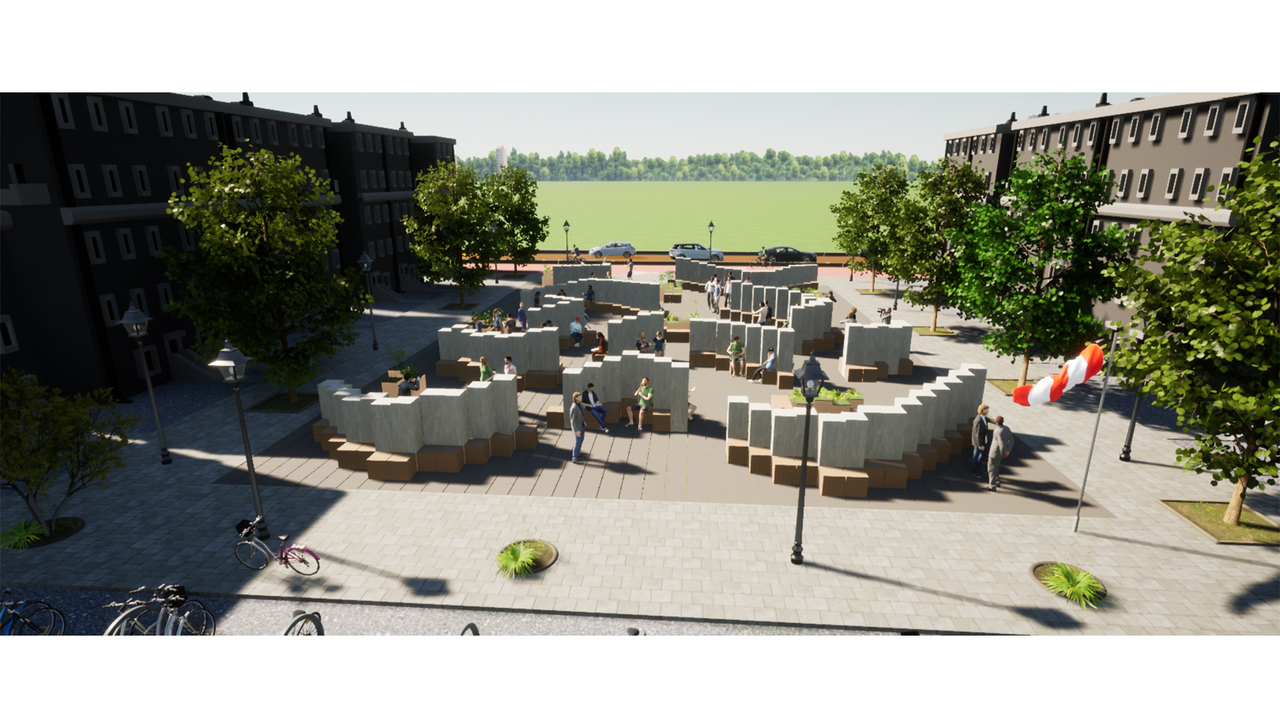
An interactive square
We created a 3D interactive experience which enables architects to test their adaptive architecture ideas in ways it cannot be done with the current tools.
Next, we hope to take our 3D interactive visualization from a virtual reality interactive experience to an augmented reality interactive experience. The digital tool can be used by architects, designers, and developers to design adaptable architectures that respond to several crisis scenarios.