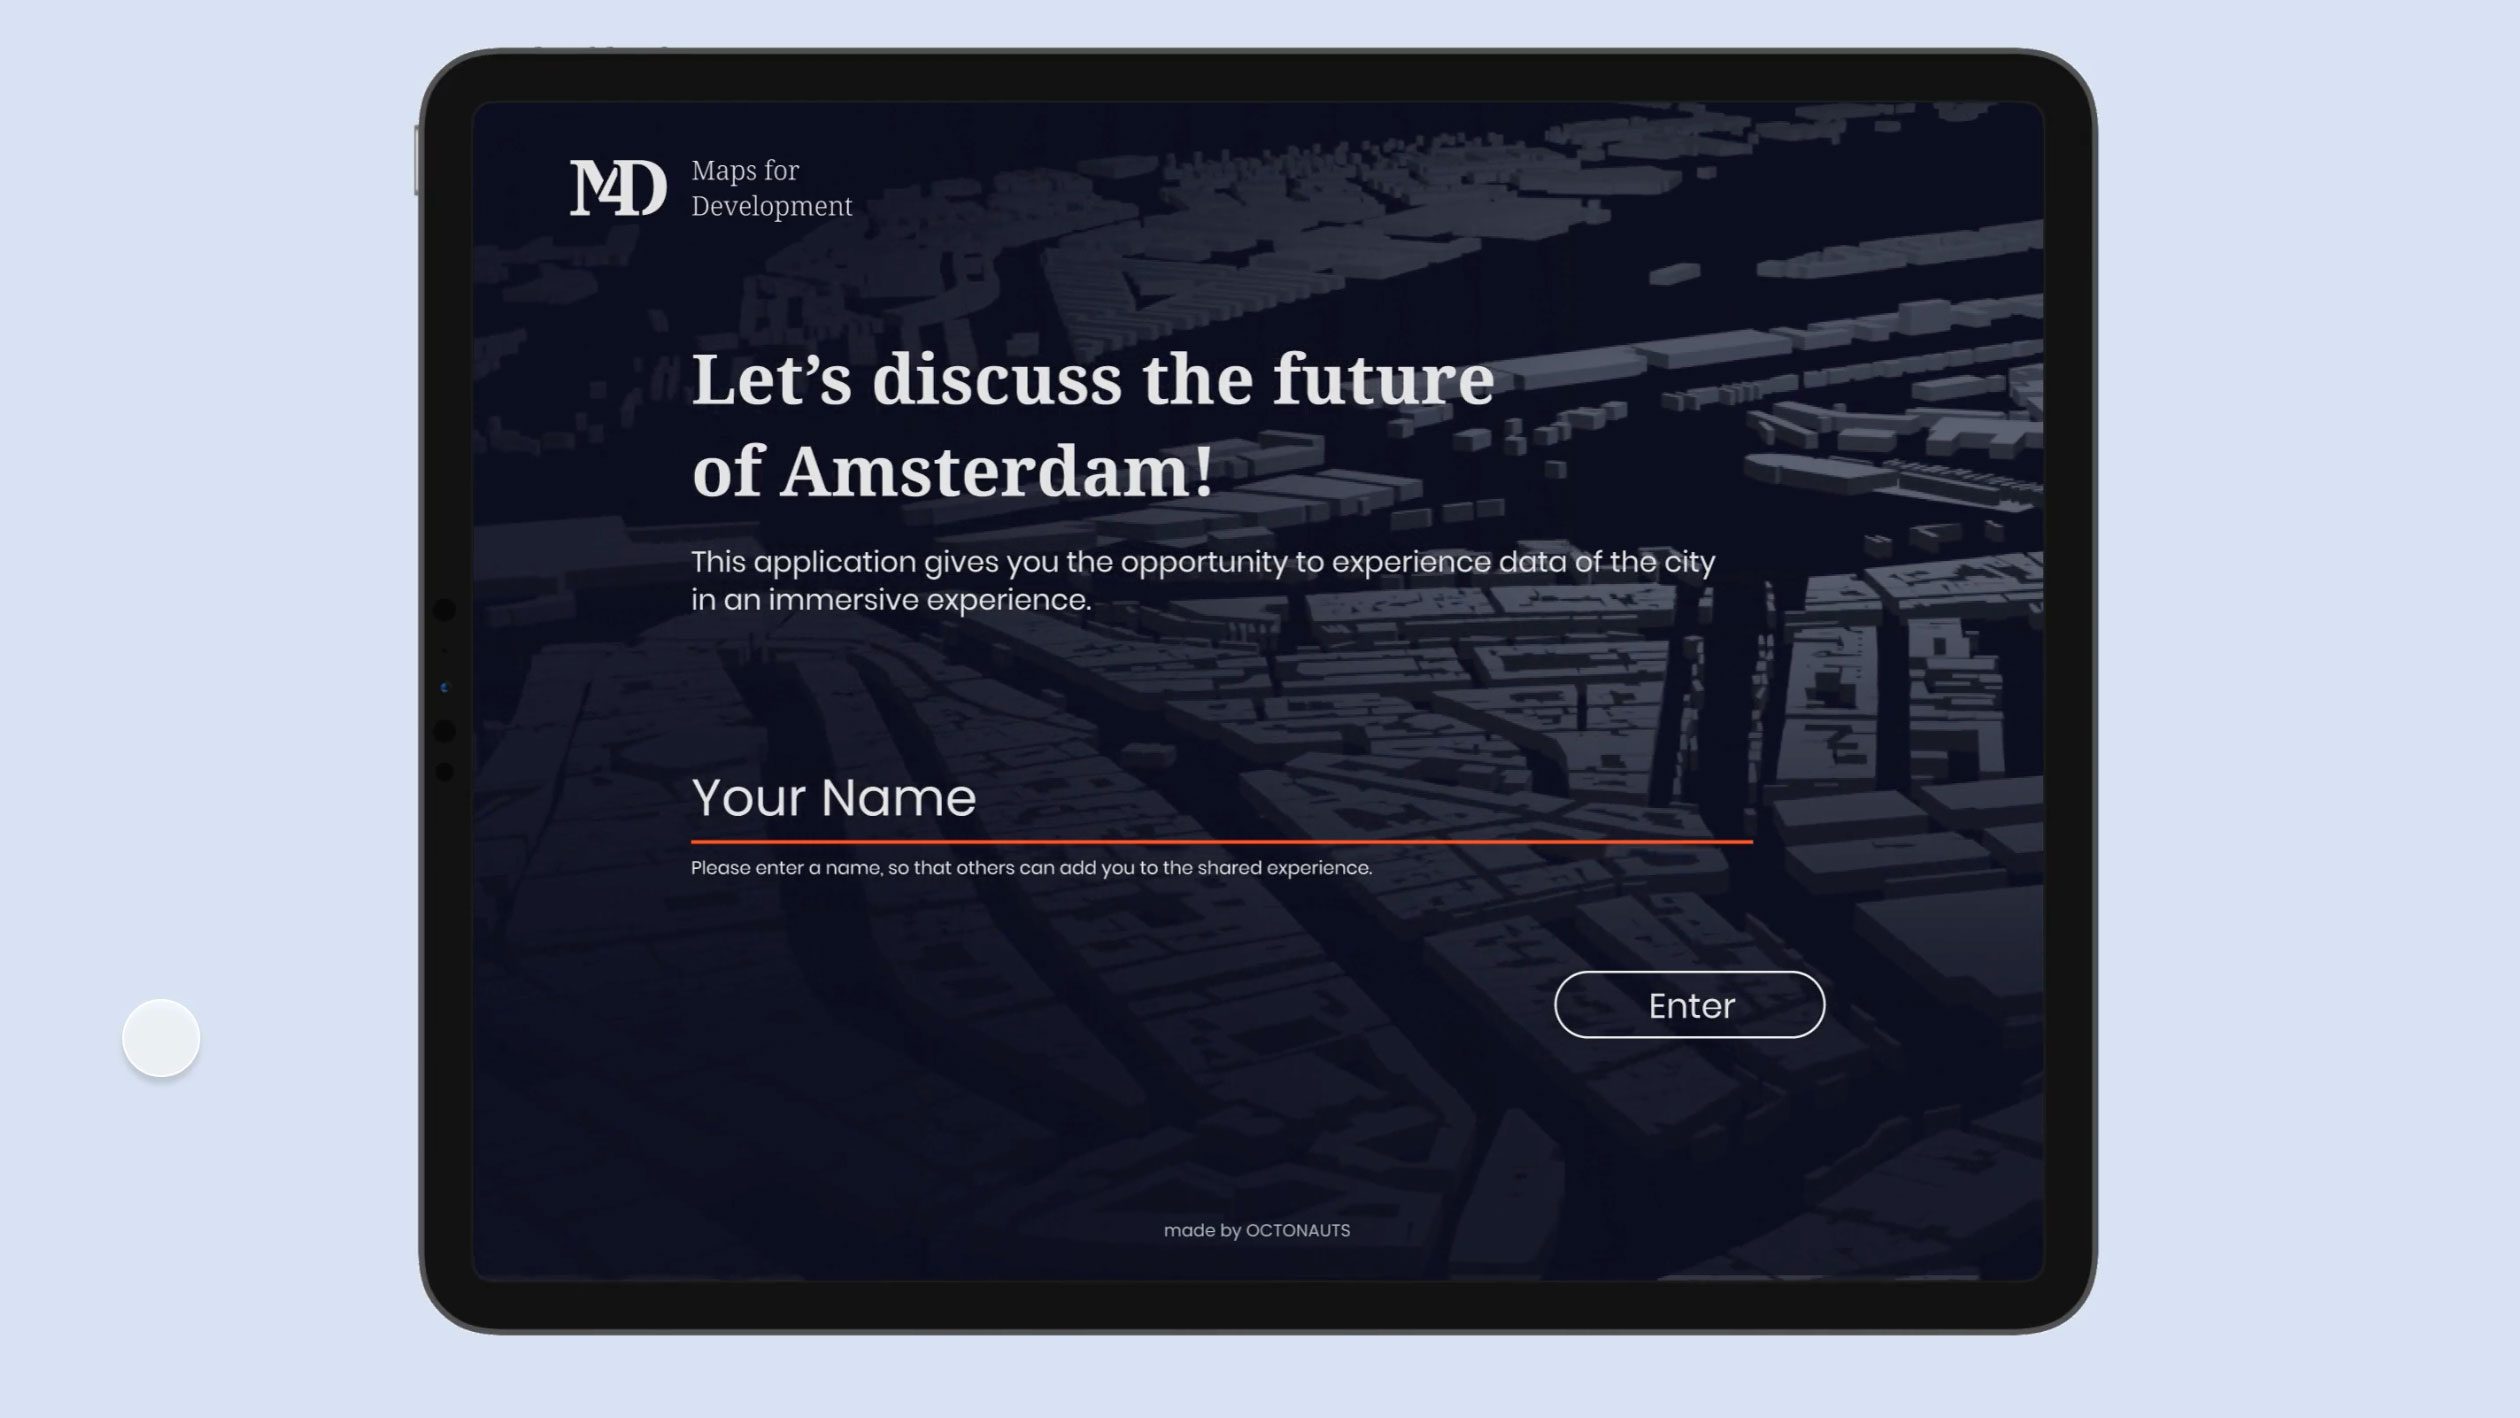
M4D – Maps for Development
Mapping Data for the Future City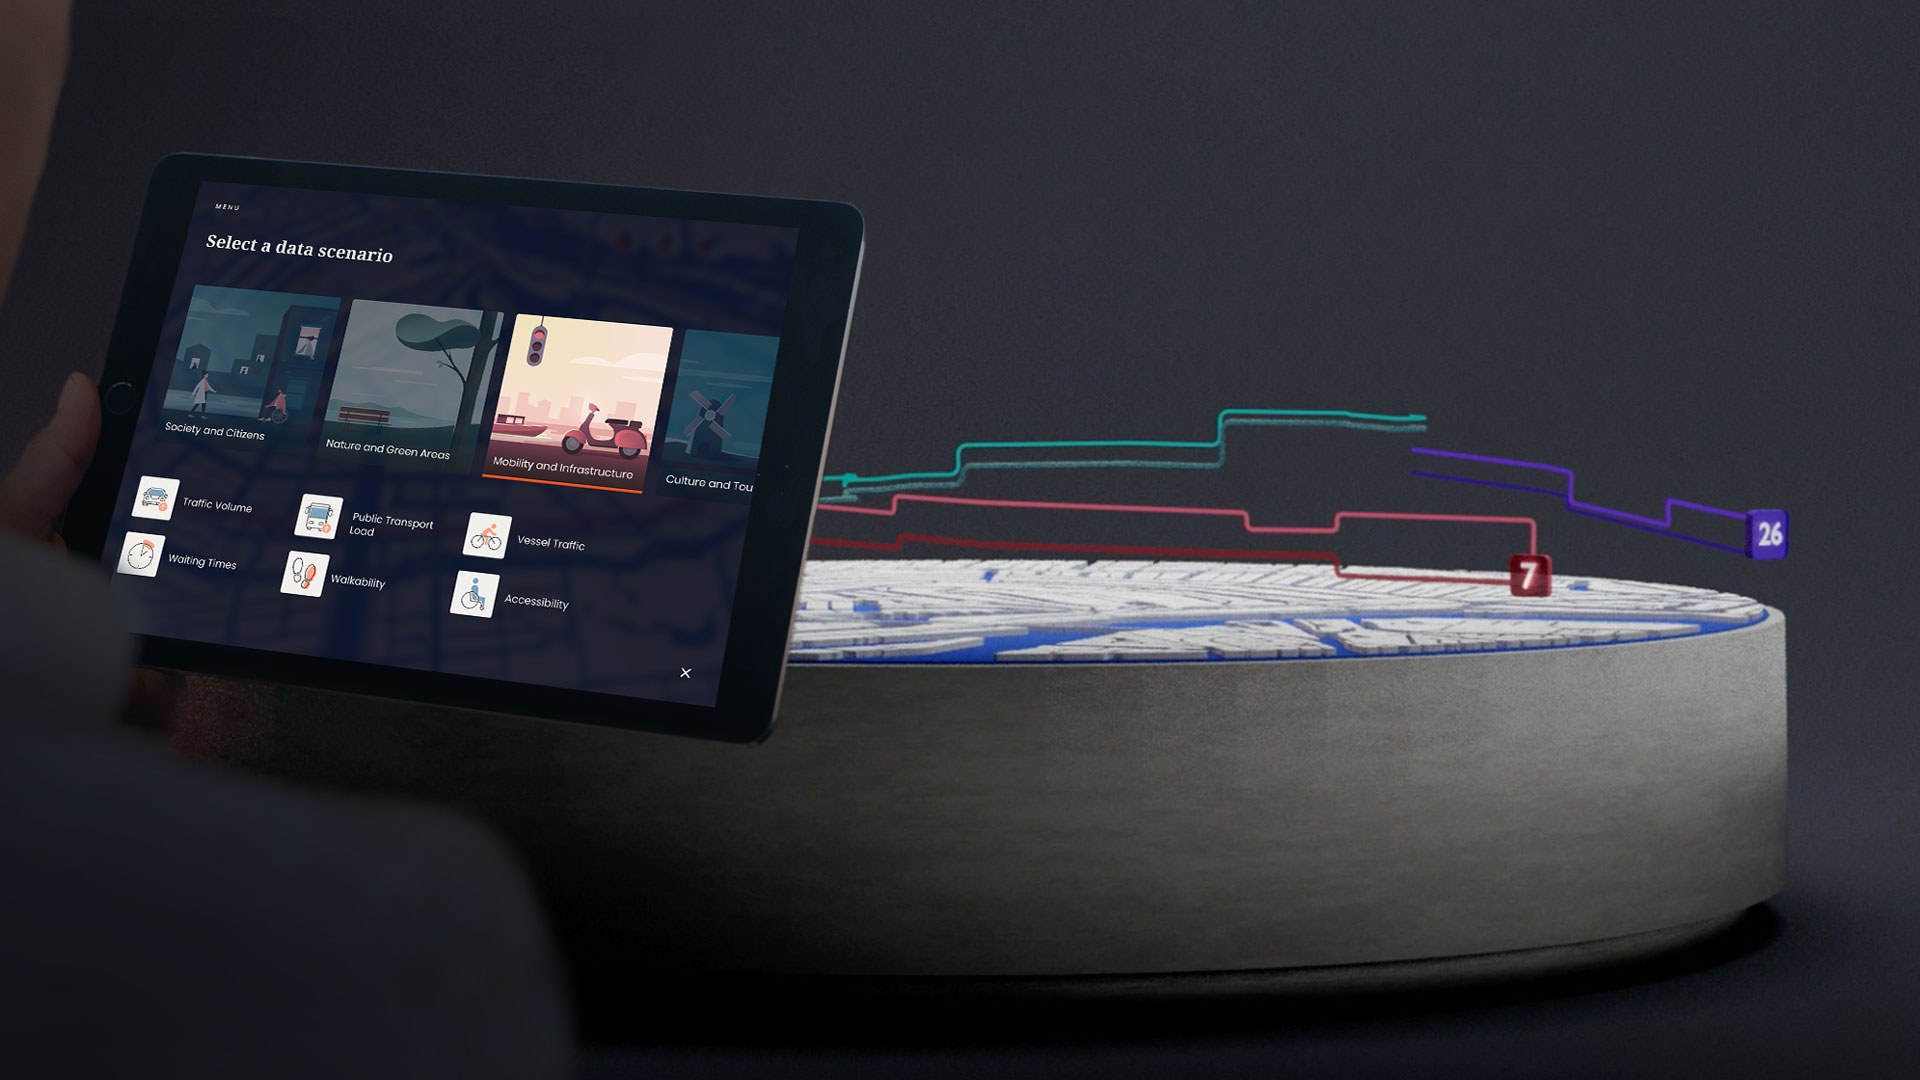
-
Client:
ARCAM
- Team:
-
Disciplines:
Concept, Product Design, Experience Design
-
Schoolyear:
2020-2021
Sometimes it’s difficult to talk about the future of a city in general terms. At the same time, current smart city technologies can collect a considerable amount of data like pollution levels, traffic congestion, rental price and many more. But transforming it into insights that are accessible, understandable and concrete for both professionals and citizens remains quite challenging.
Our brief asked us to explore possibilities on how to use a 3D model of Amsterdam as a starting point for discussing the future in a multi-stakeholder conversation. In the medium term, our clients would like to produce a high-quality exhibition piece allowing citizens, city planners, politicians, and experts to look at and work with data visualizations. Their idea was to combine projection mapping with a 3-metrelarge urban model. There are, however, two problems: this model is huge and doesn’t show only Amsterdam but the region of Noord Holland, which makes it difficult to project detailed data visualizations.
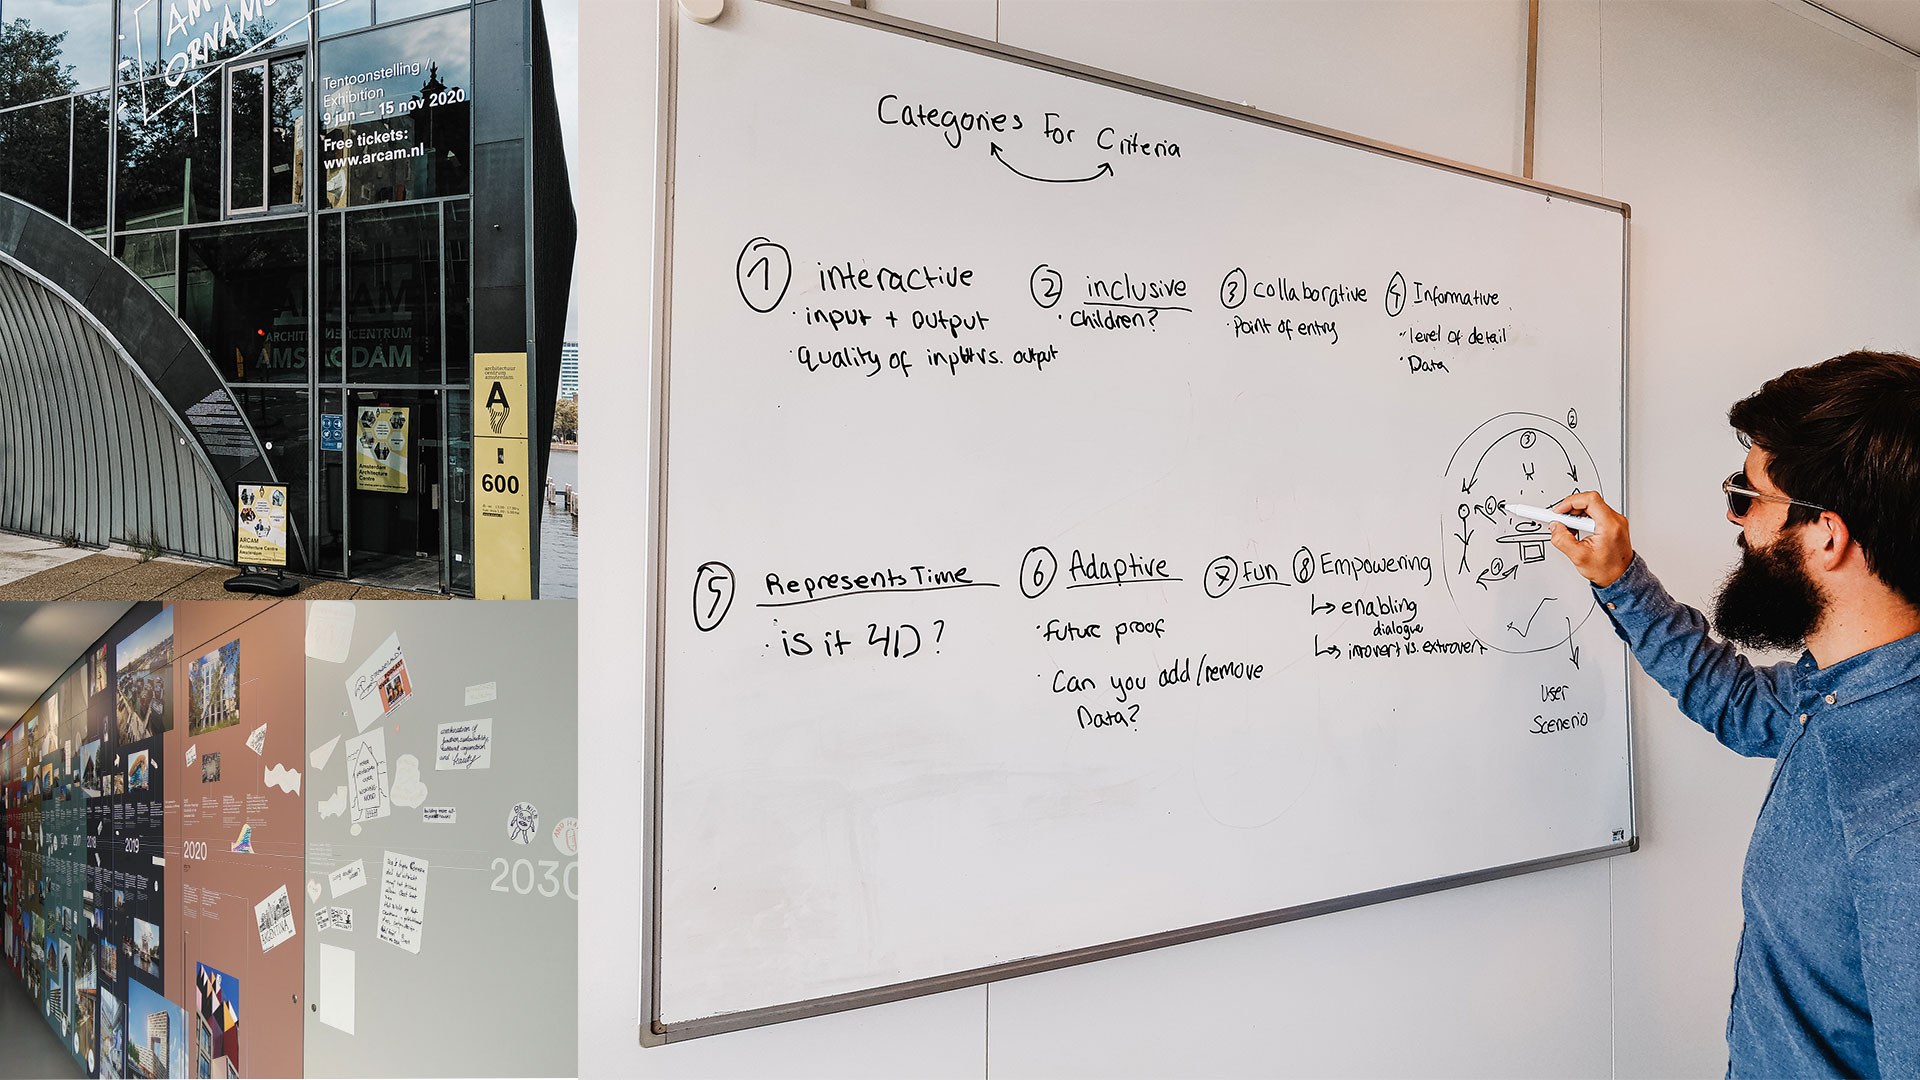
Going beyond the brief
We came to the conclusion that we could not work with the specific table that our client suggested. Furthermore, we scrutinised whether projection mapping is the best technology to be used for this. We decided to look into four technological options: Projection Mapping, Virtual Reality, Augmented Reality and Mixed Reality with AR headsets. To evaluate the potential of each, we defined nine criteria challenging how feasible, interactive, inclusive, empowering, adaptive, representative of time, engaging, informative, and collaborative each technology is.
The assessment of our research showed that a combination of the best features of each technology works best for the requirements of our project. And so we came to the idea of a collaborative AR application that runs on tablets showing data visualizations on a map of Amsterdam, that is made of 3D printed hexagon tiles.
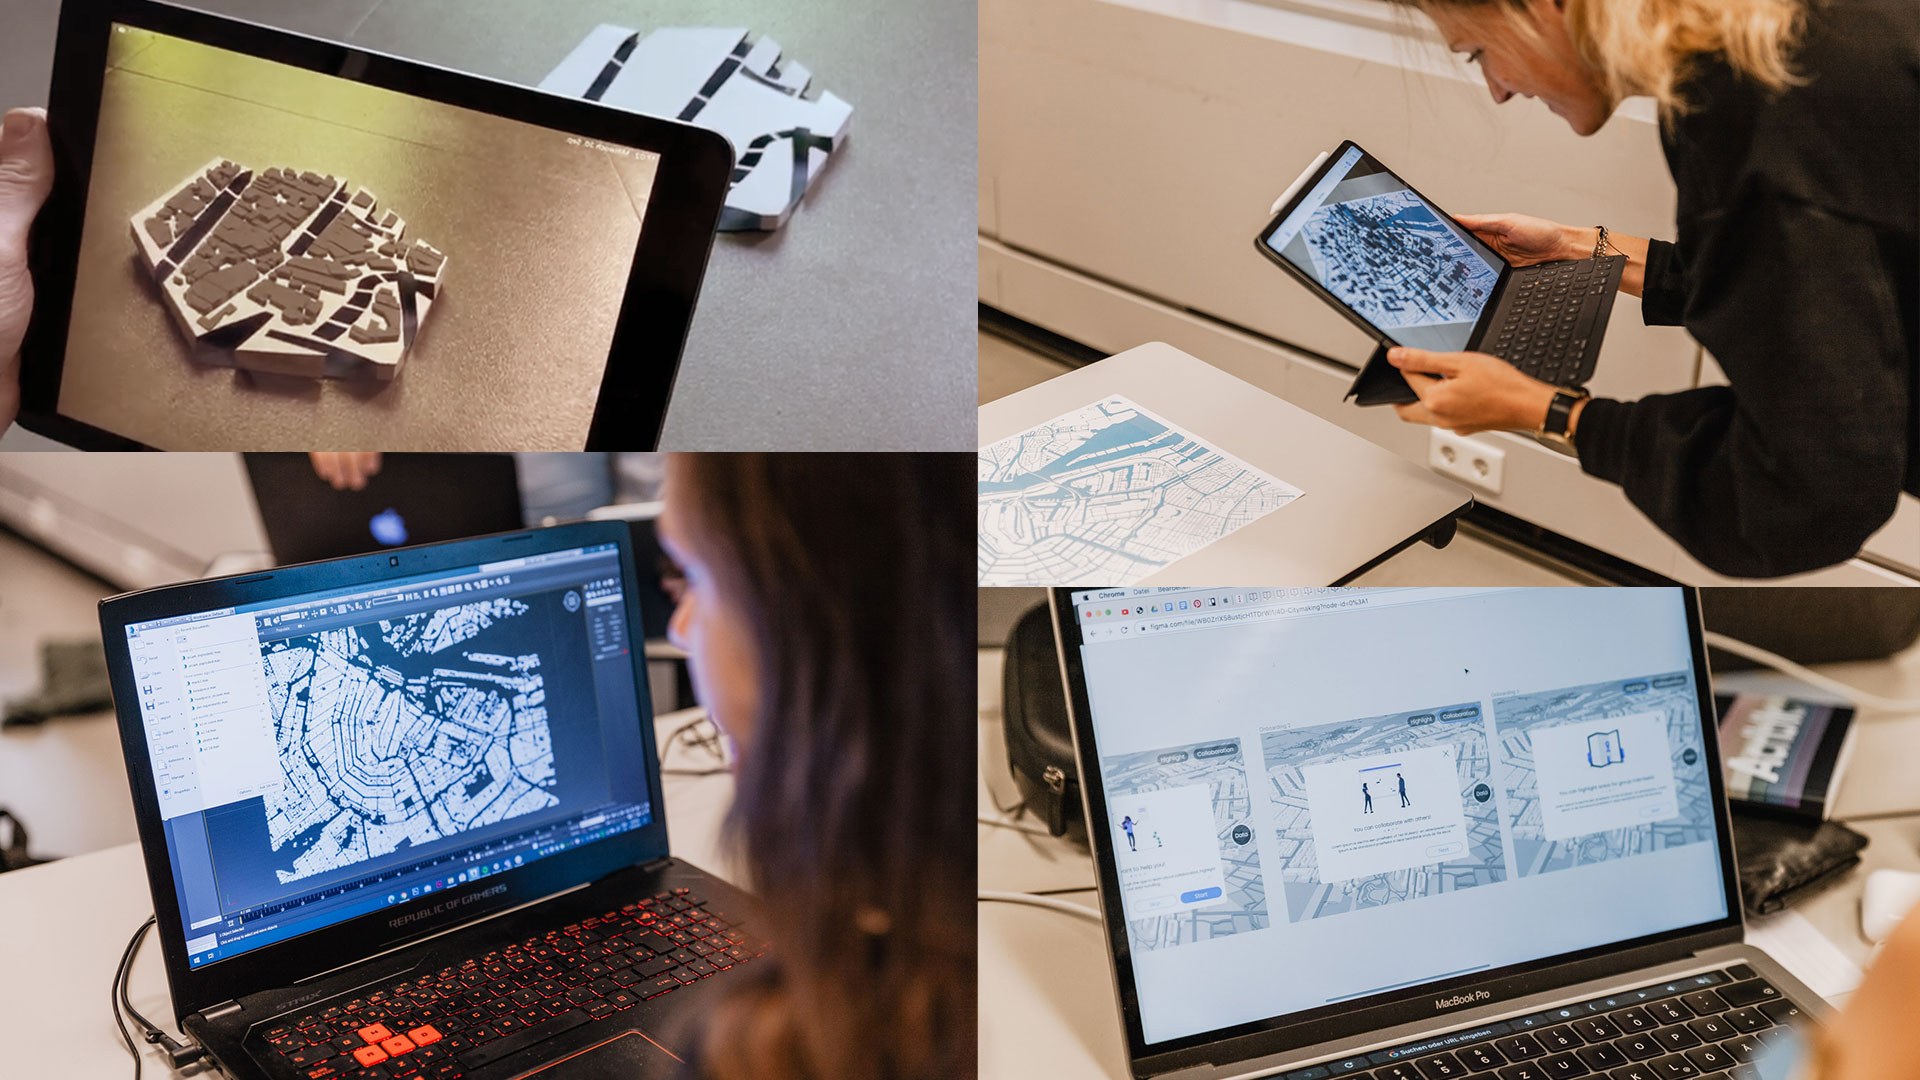
From Idea to Execution
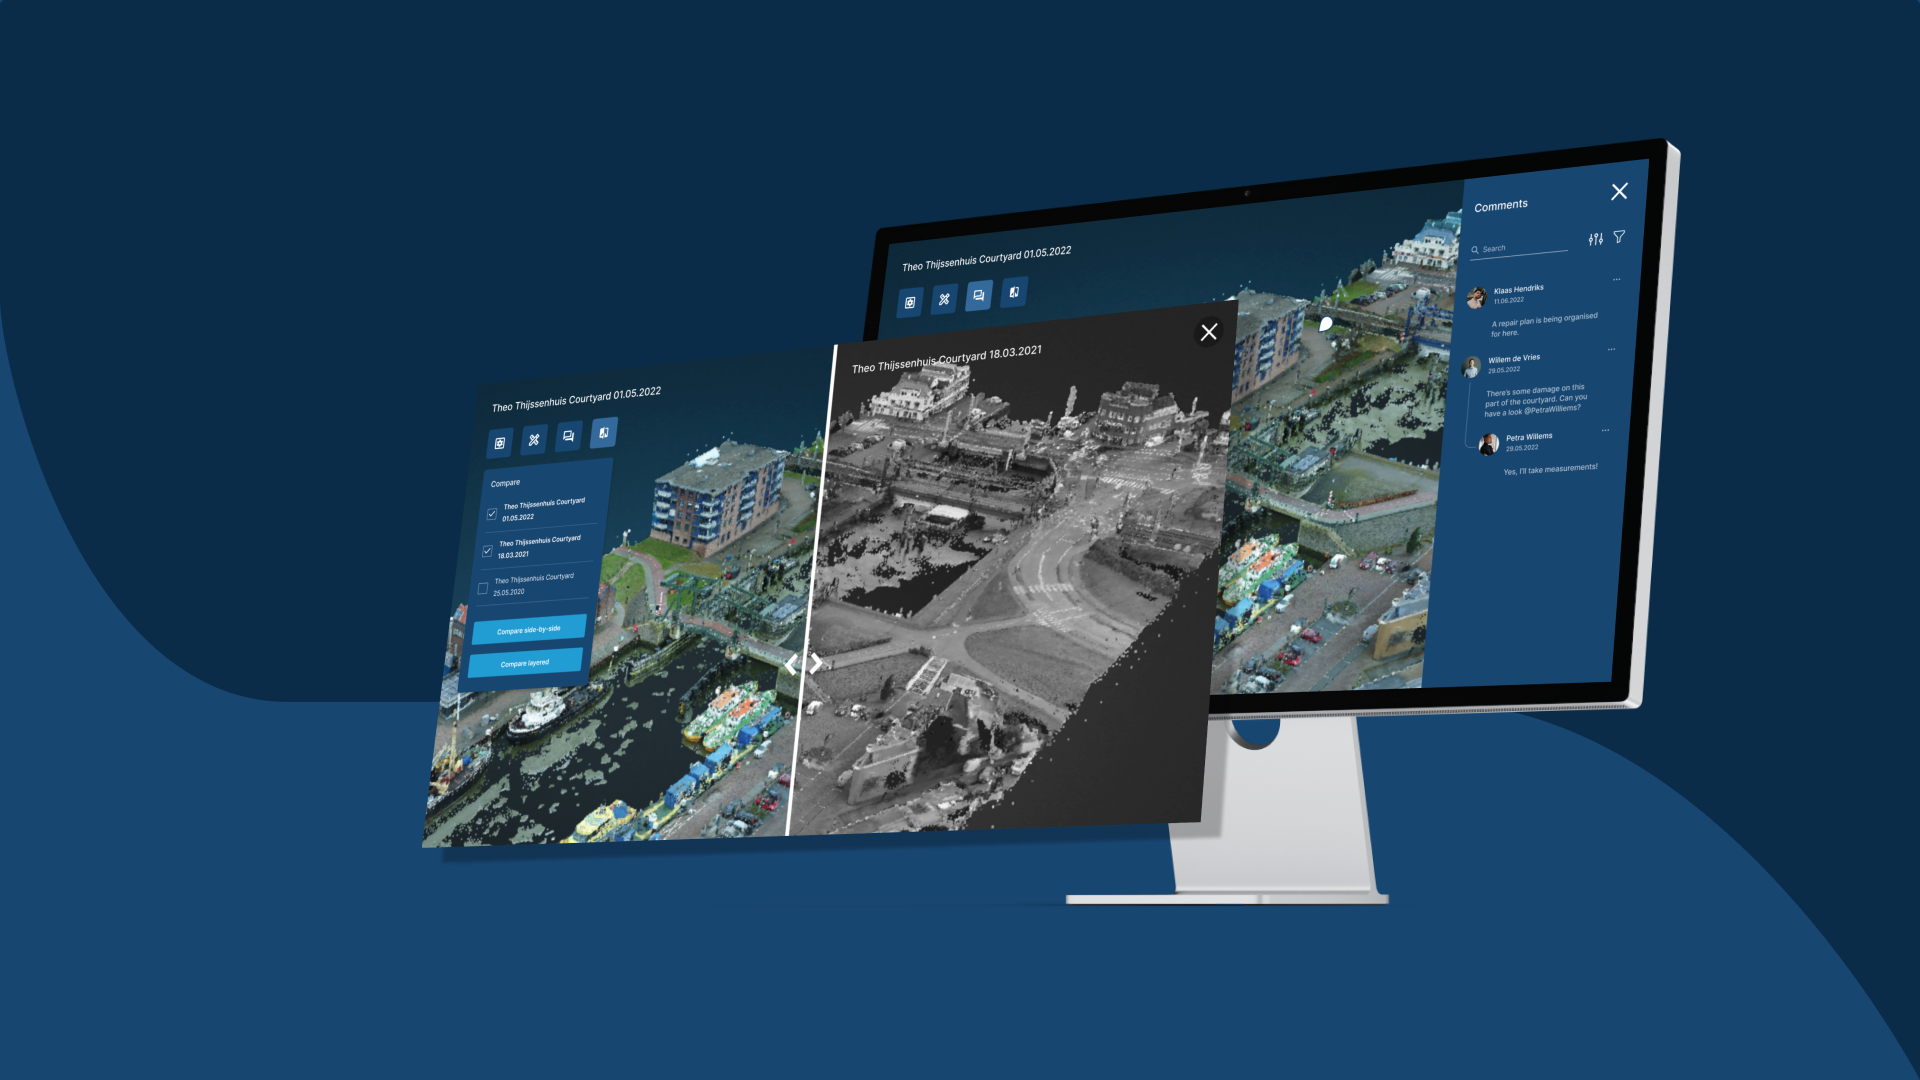
Combining elements of different technologies to fulfill the requirements of our brief, in theory, sounds like a valuable idea. In practice, this meant to produce 3D data visualizations in blender, to bring them alive in an augmented reality toolkit, to design and prototype a user interface in Figma and 3D print hexagon tiles in about one week. Oh, and we also needed to user-test it.
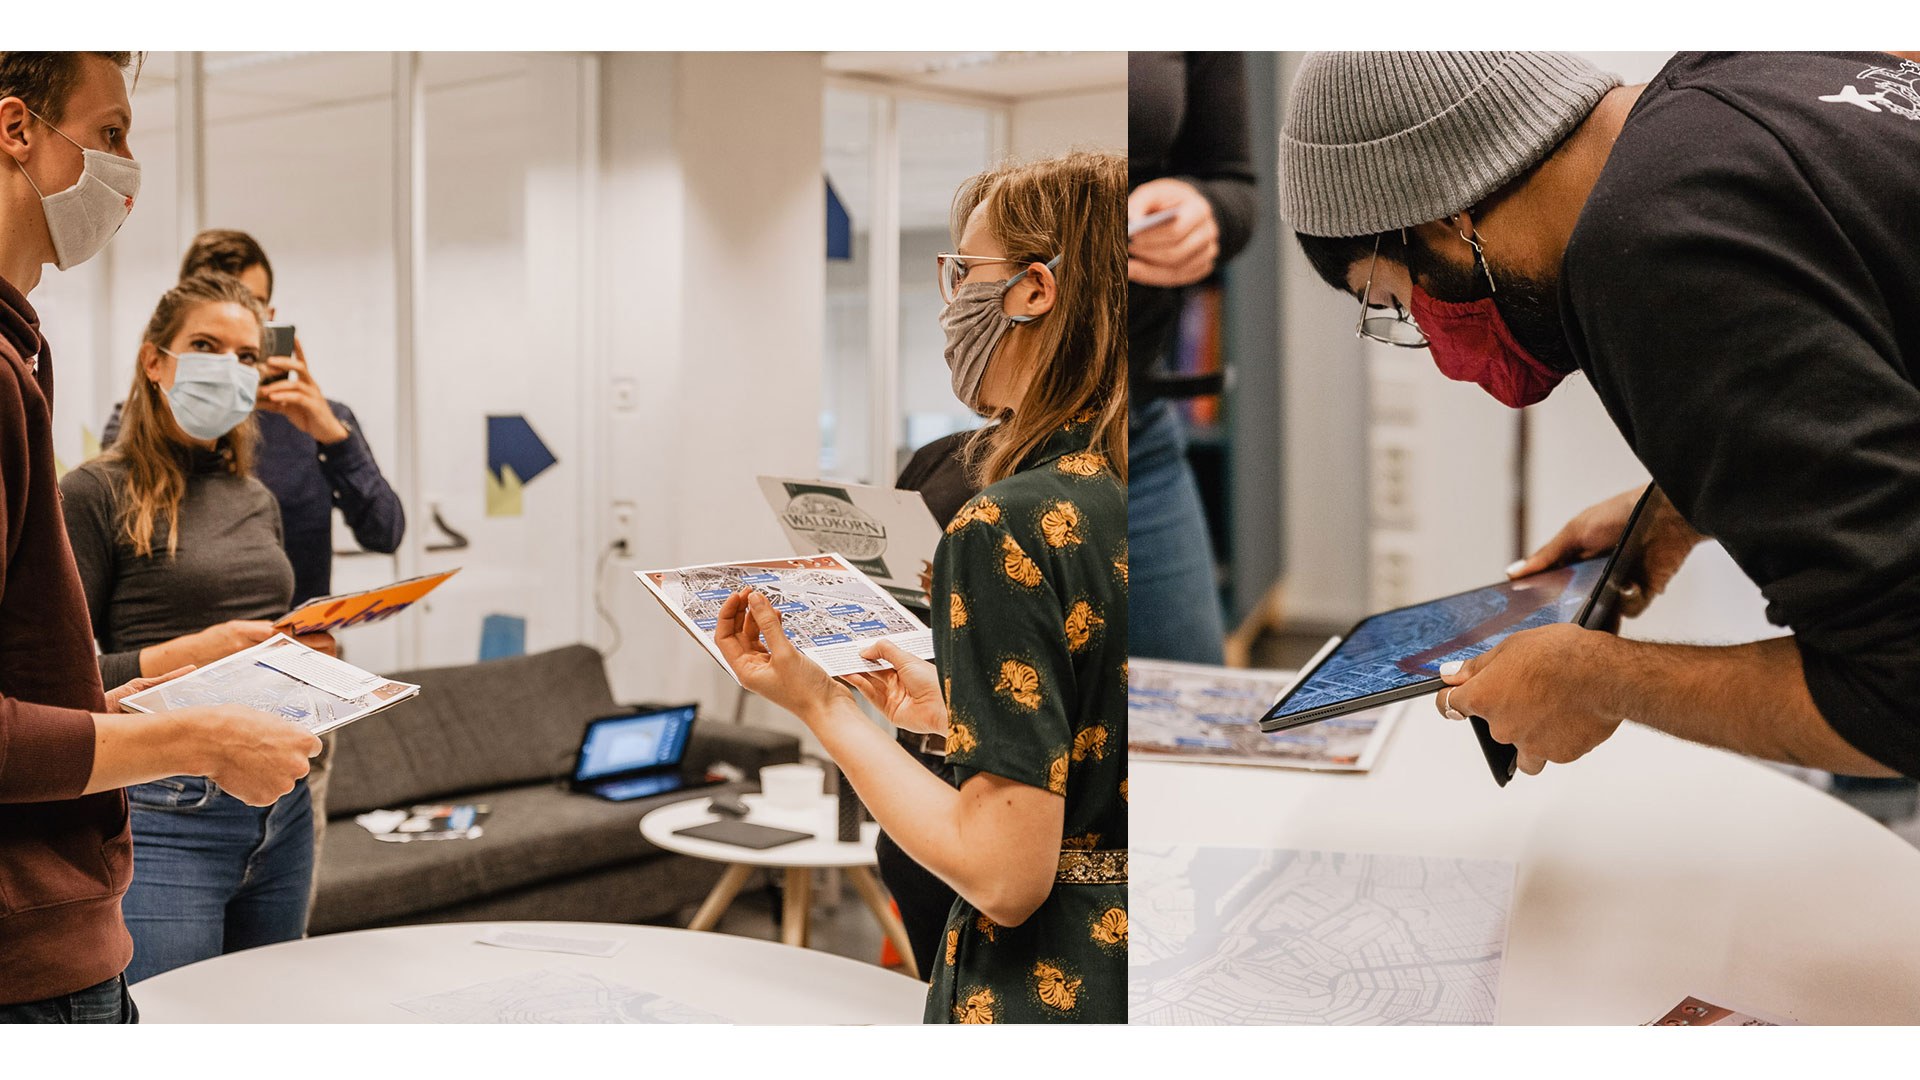
Interacting with the M4D
With a low-fi version of the interface, we were able to do A/B test versions of the menu and collaboration mode. But one point of criticism remained: Don’t tablets stand in the way of having a multi-stakeholder conversation? With paper-prototyped tablets showing data visualizations and a roleplay we examined whether a handheld device distracts participants from having a discussion. The test showed that participants intuitively look at the same data visualizations and base their argument on what is in front of them.
Watch the video about the M4D application