Druktemeter Hilversum
Making data on city crowding more visible and accessible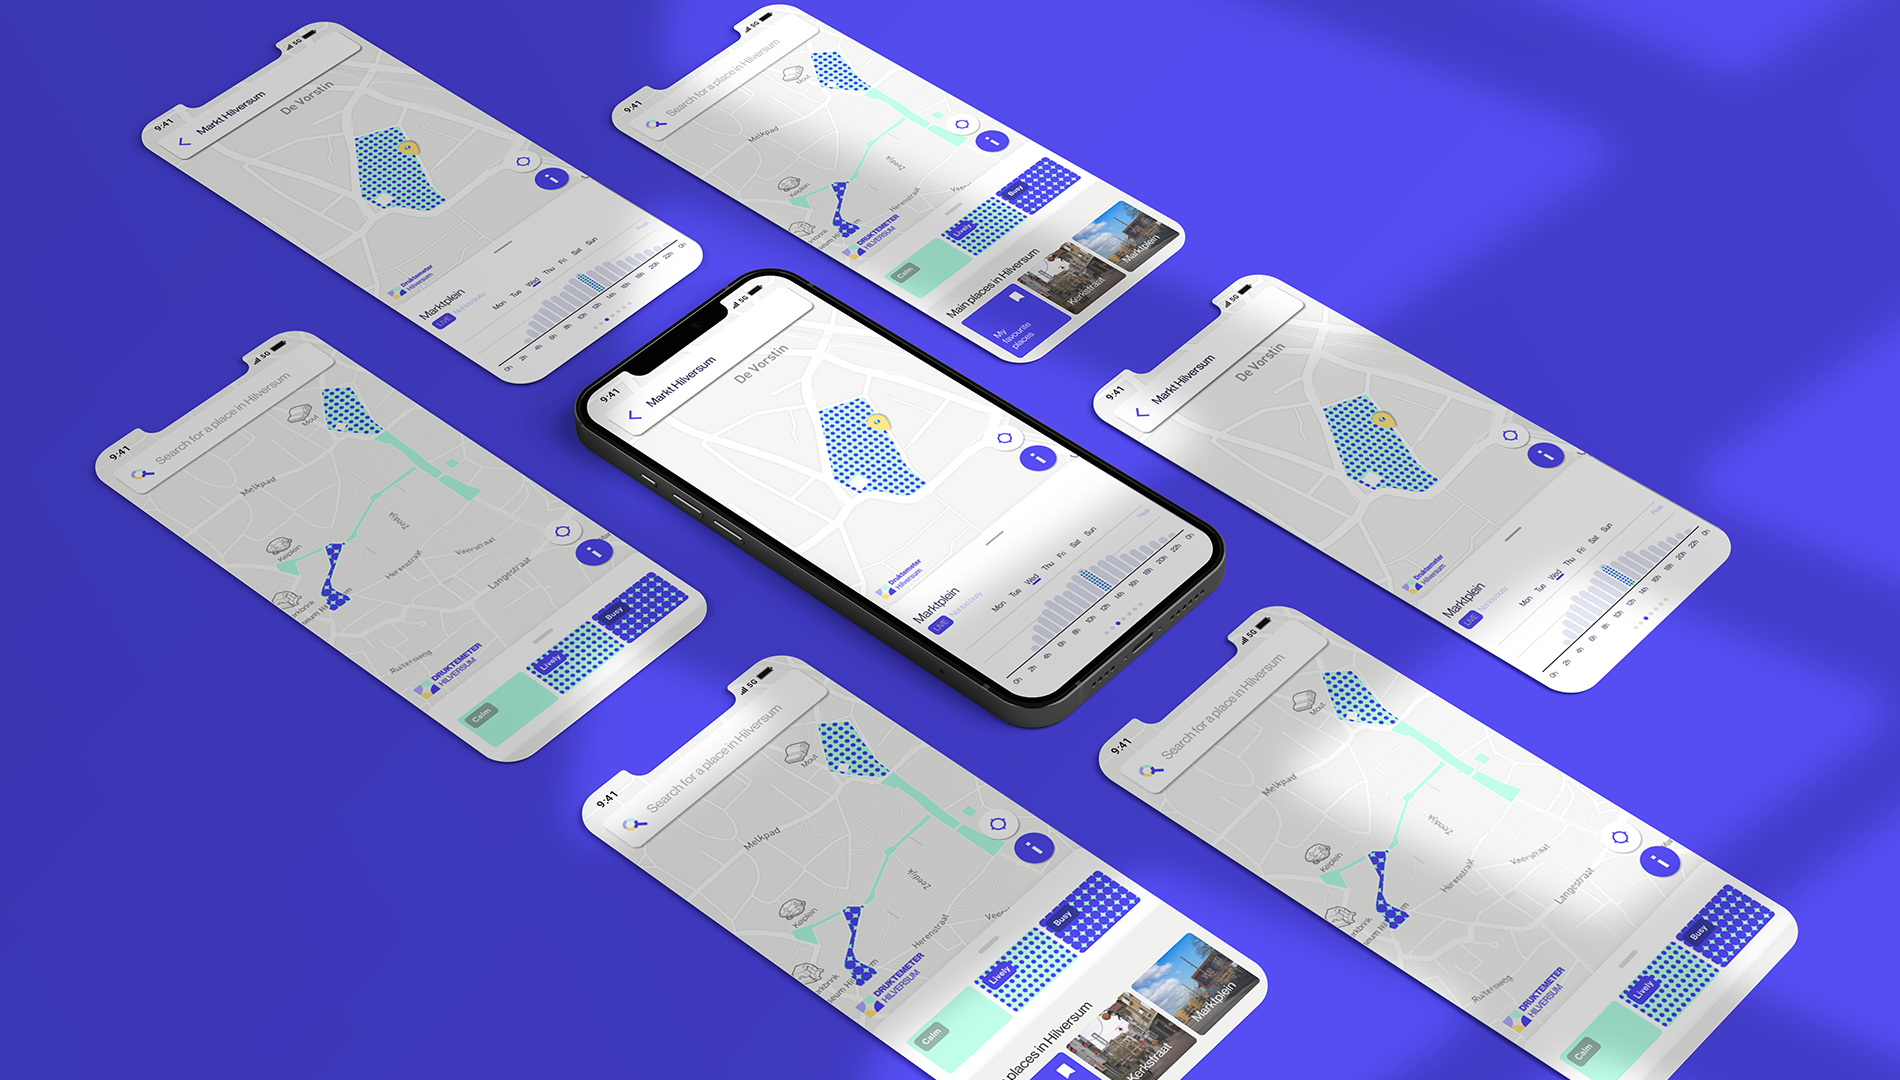
-
Client:
Robot Kittens
- Team:
-
Disciplines:
Concept, Product Design, Experience Design
-
Schoolyear:
2020-2021
Nowadays almost half of the global population lives in cities and by 2050 the UN estimates that this will increase to 68%. To manage urbanization we need information technology as it comes with several challenges. Freedom of movement is one challenge that became even more important since COVID-19 and cities all around the world are engaged in a race to get smarter.
The city of Hilversum is always trying to stay at the forefront of the digital and data revolution. The municipality developed a service named Druktemeter (busyness meter) for the inhabitants to help them move freely and to plan their visits to the city centre. Our task was to help the municipality of Hilversum to make their service on city center crowding more visible and accessible for the citizens.
The design challenge: Make it visible
Our design challenge led to the direction of exploring ways to make the Druktemeter more visible for citizens, trying to make it part of the citizen’s journey to the centre, and visualizing the data of the service in an easily accessible, inclusive, and understandable way.
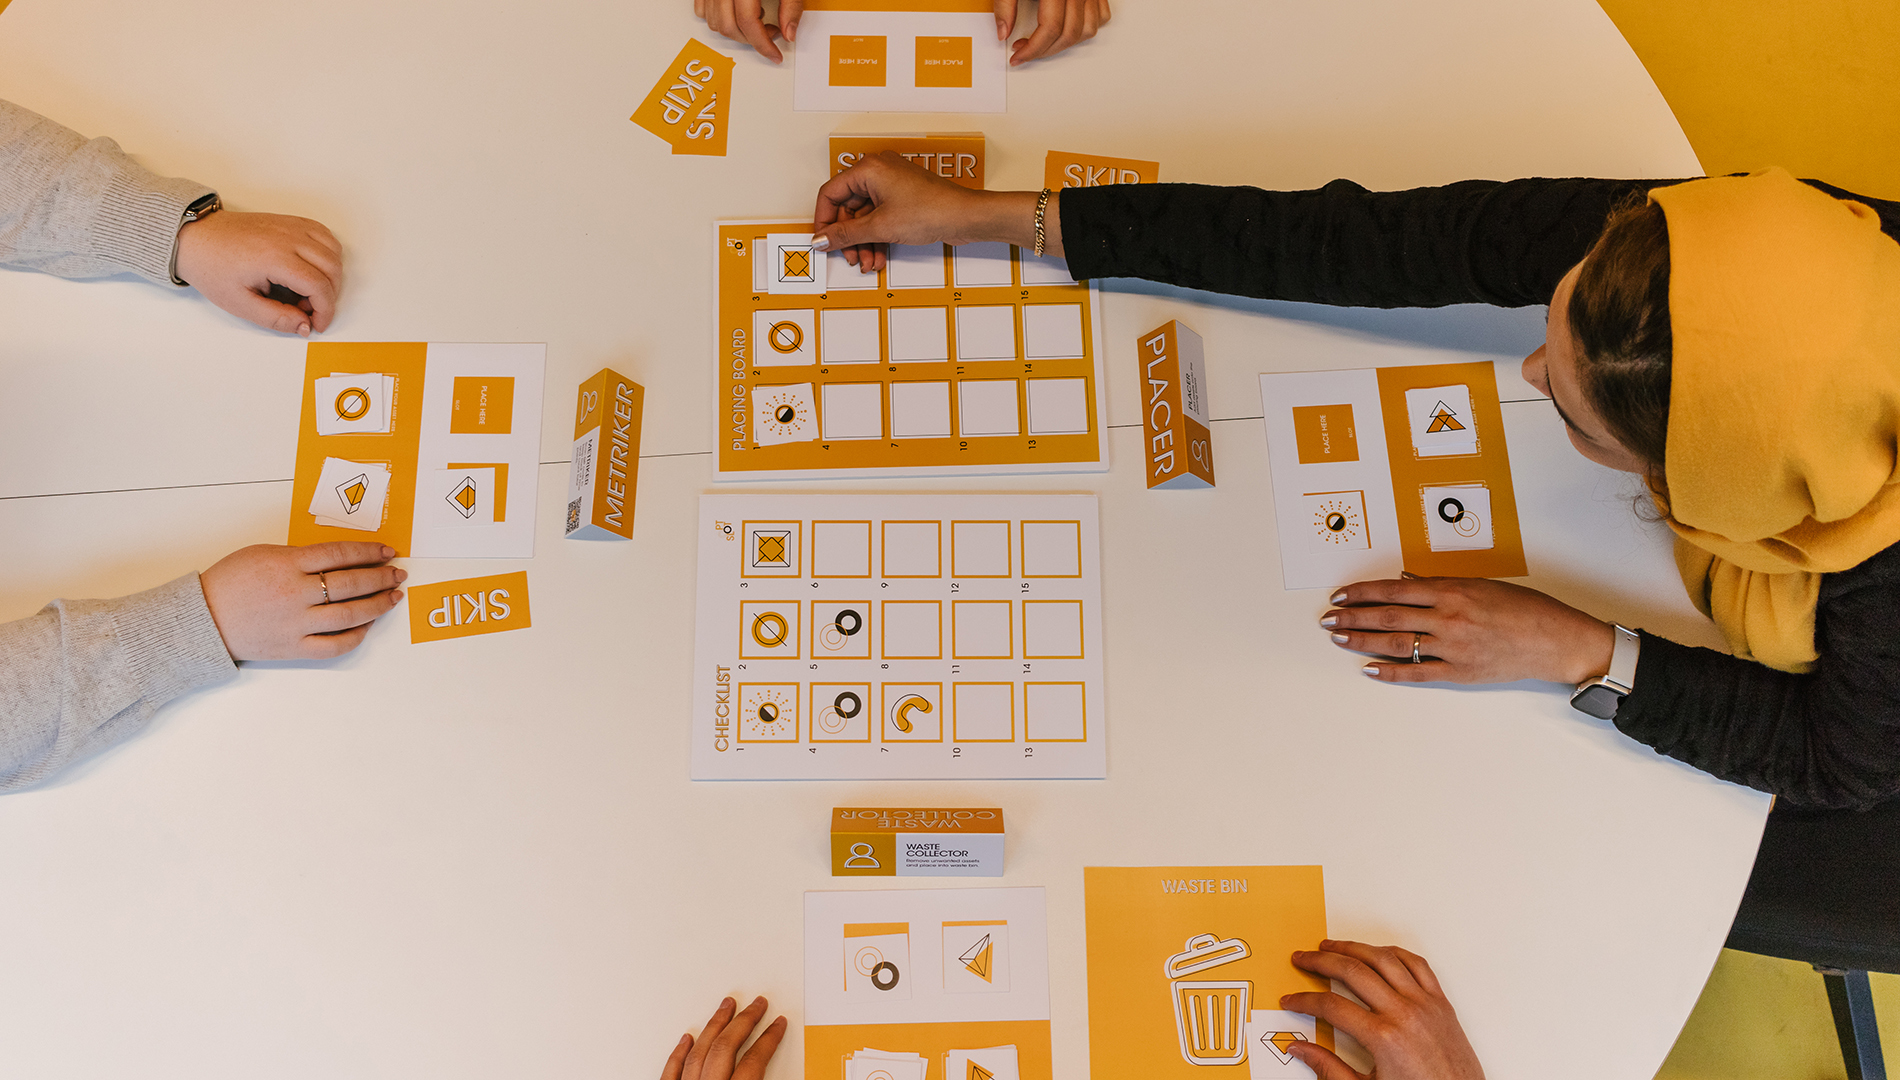
The Process: Explained
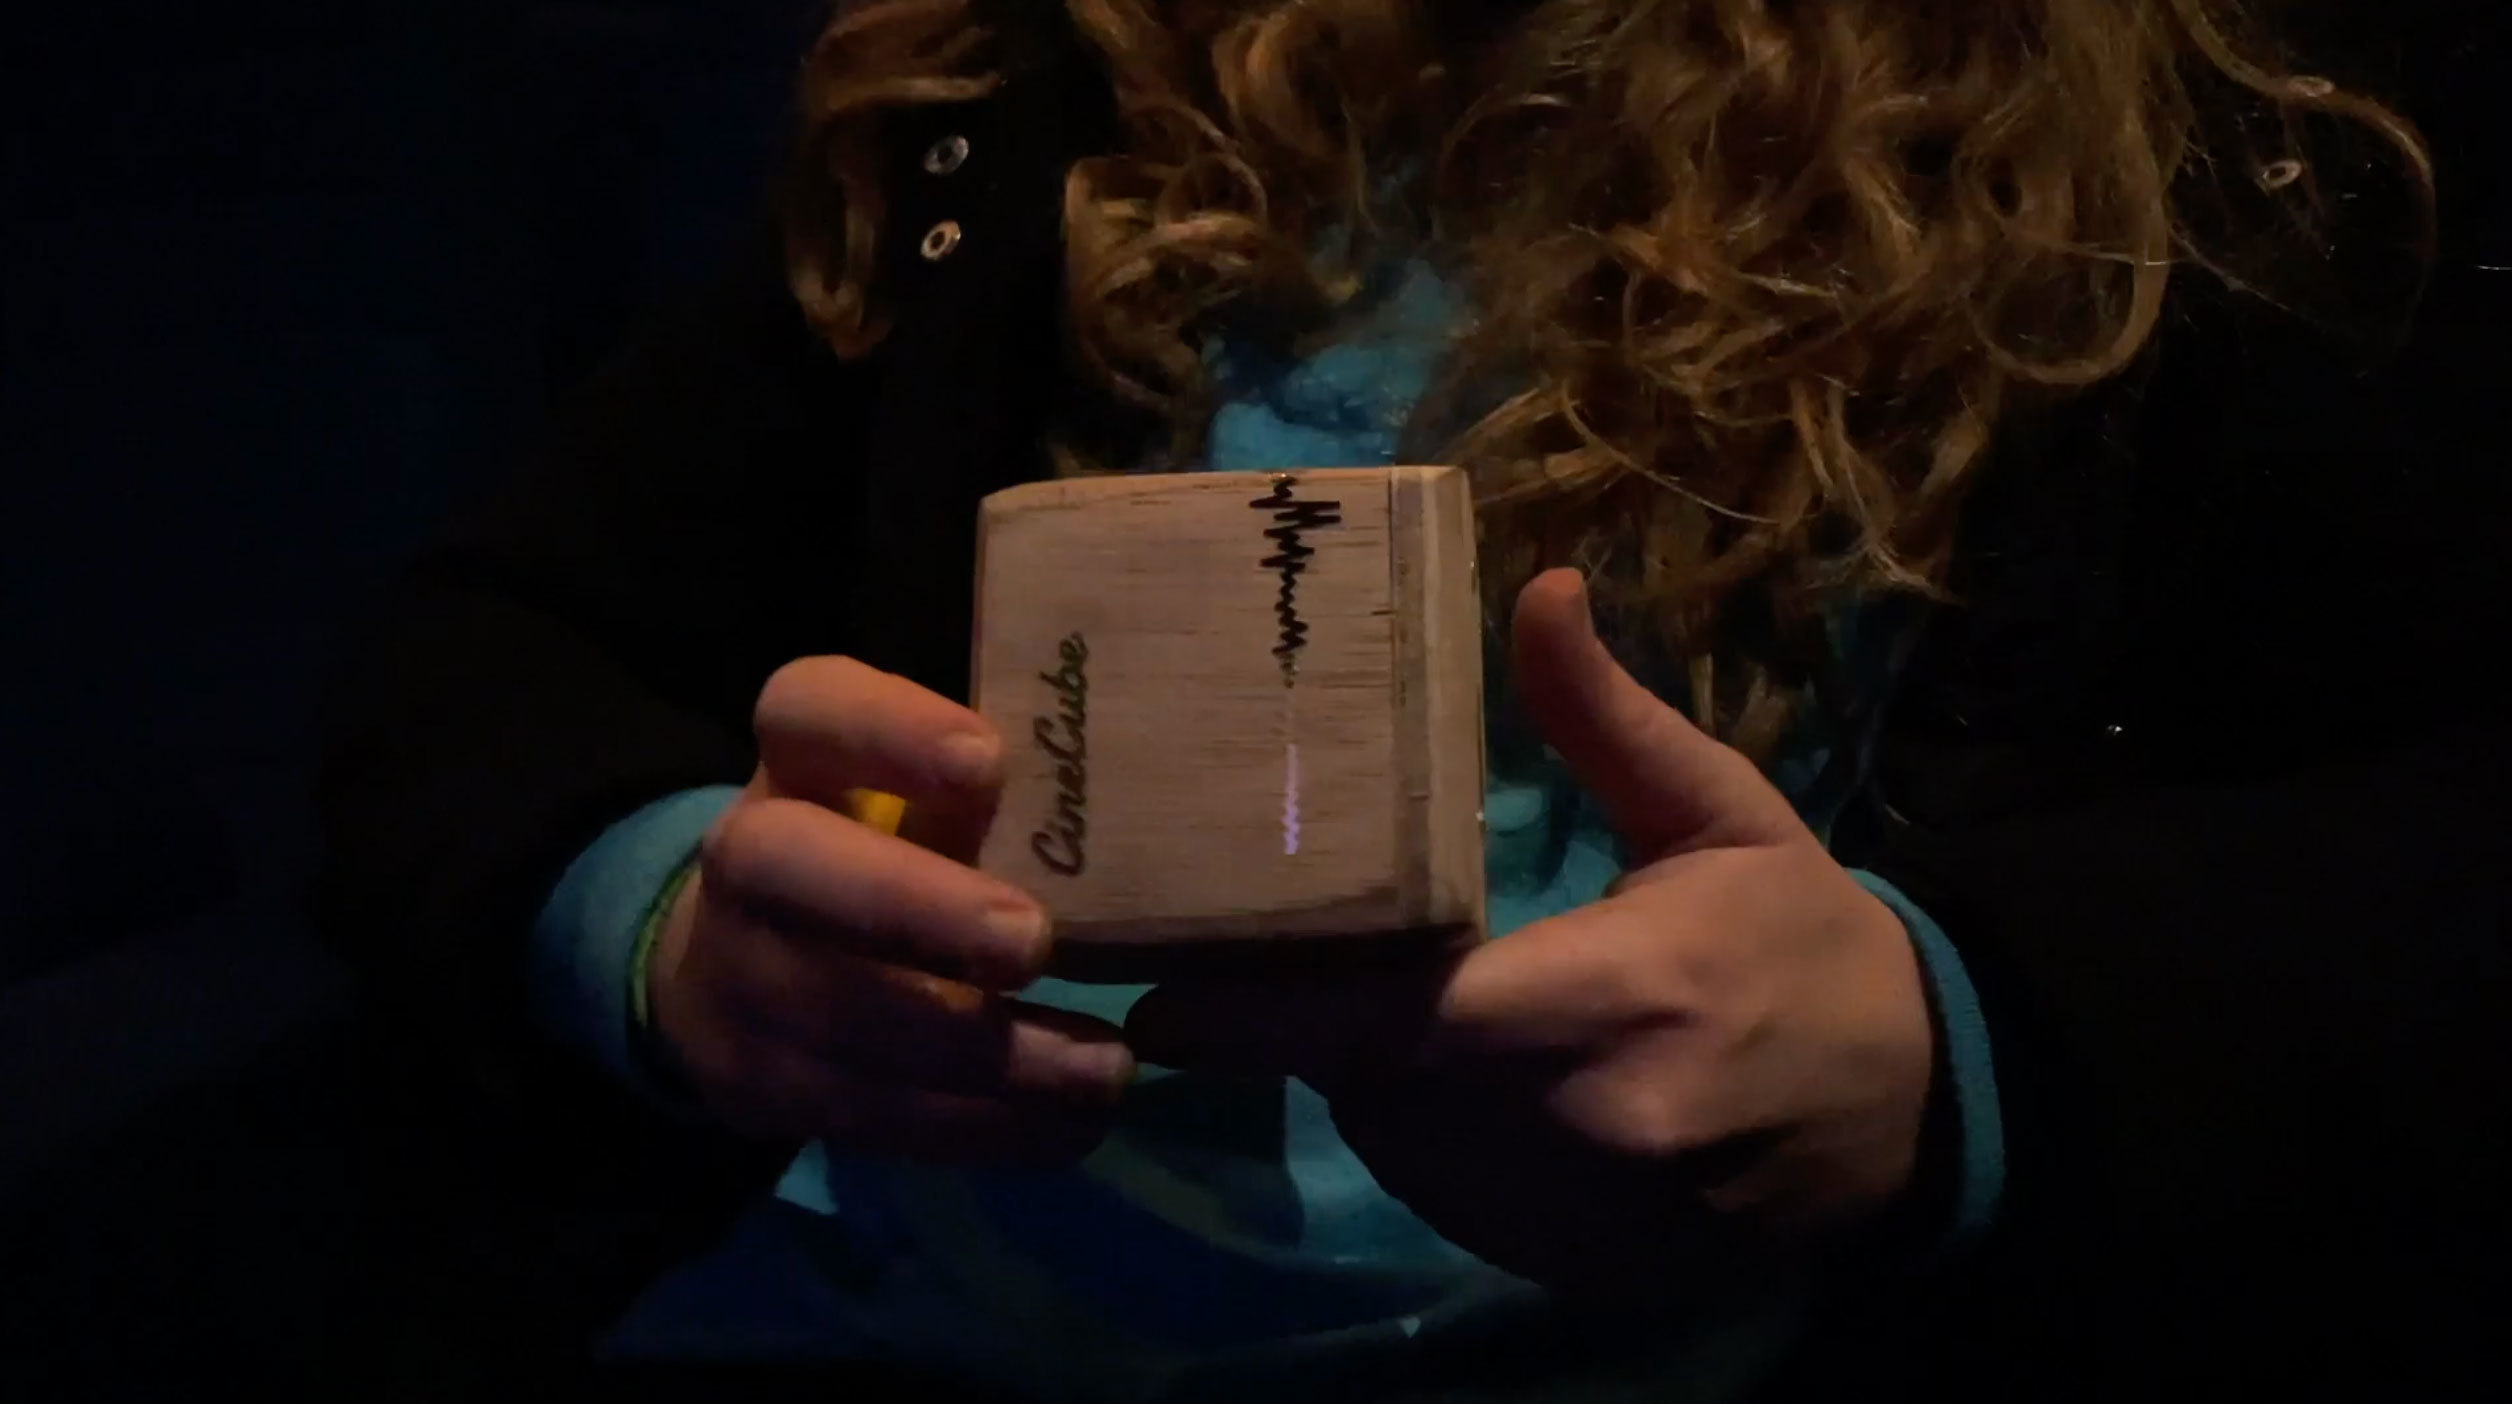
Through interviews and co-creation, we learned that using the Druktemeter has part of your routine when heading out to the city centre is something citizens of Hilversum are not really used to. We needed, therefore, to bring this action into local behaviour, starting by captivating their attention and nudging them about the existence of the service. Alongside, we noticed that our target group found it hard to engage in data-driven conversation because they couldn’t relate to this topic. To accommodate these findings, we created the physical installation. The purpose of the installation is to give access to citizens to live data around crowdedness and to make this data more tangible.
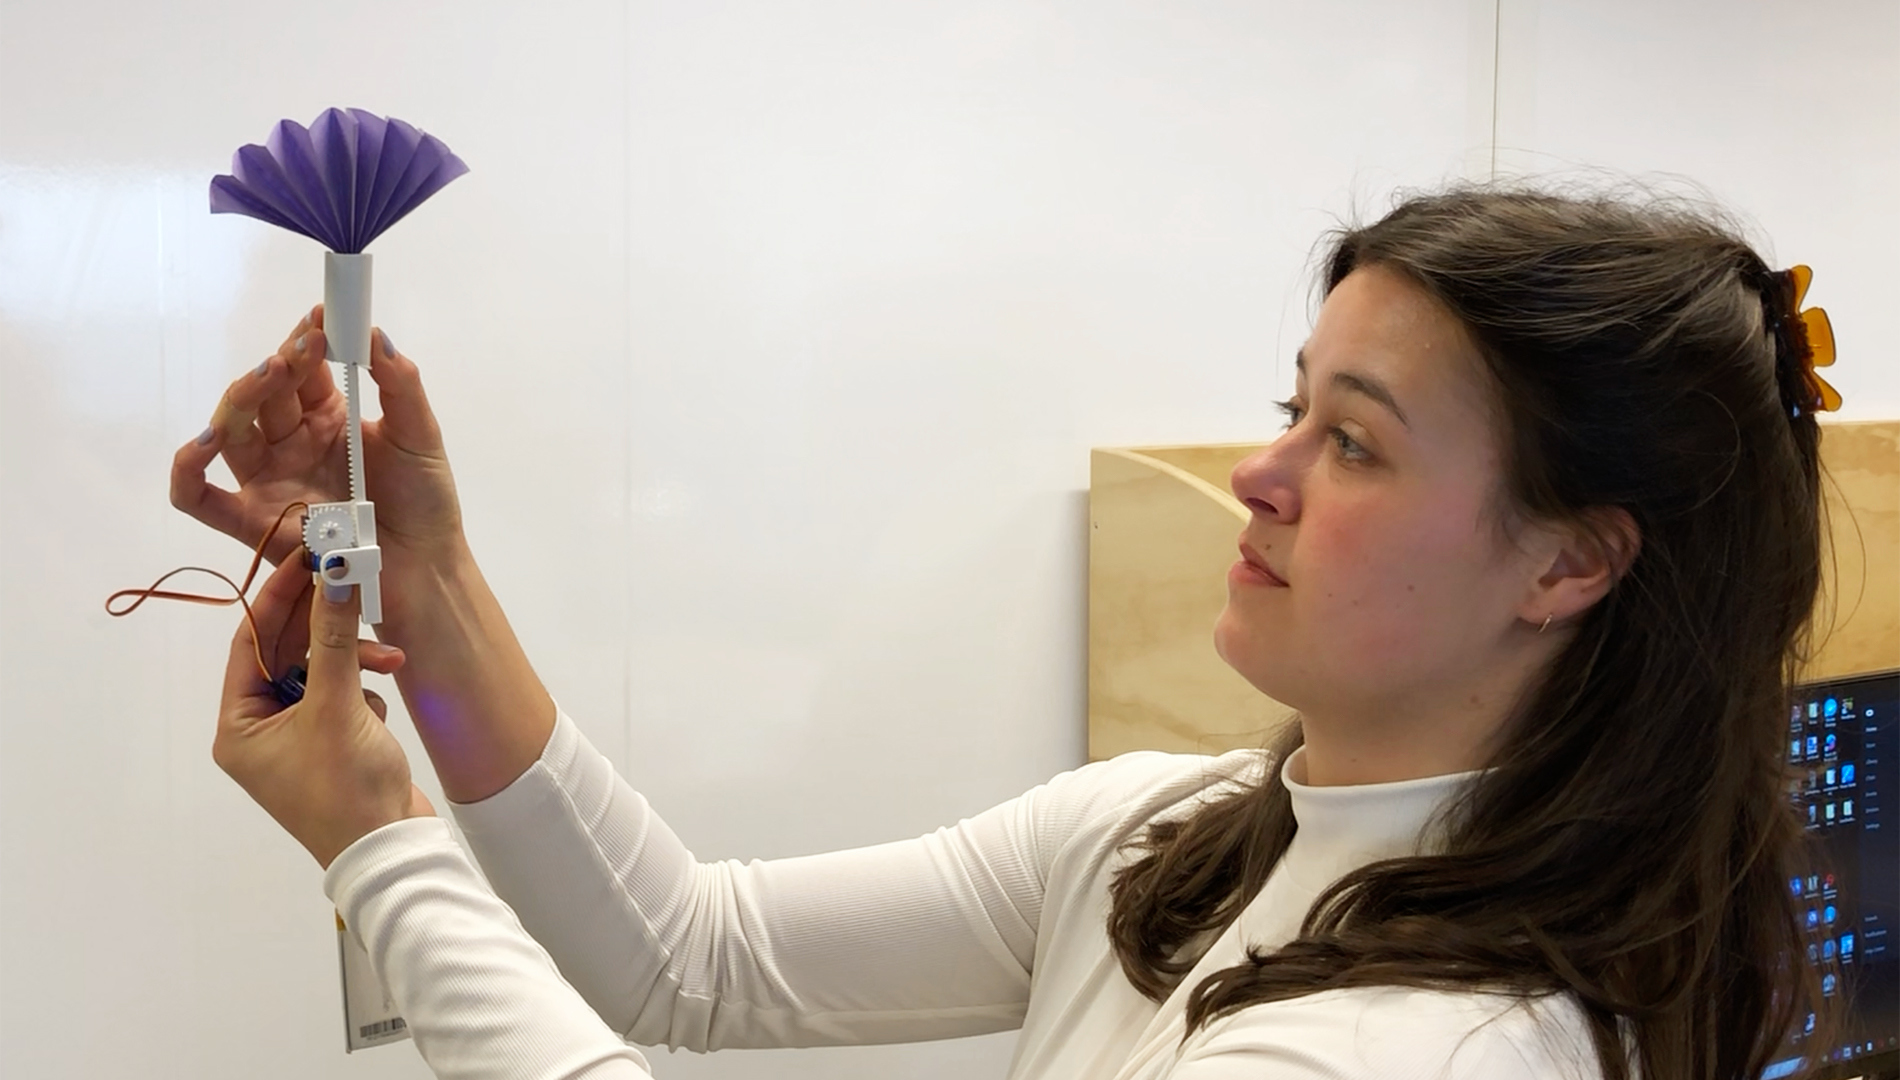
We did several rounds of prototyping and exploration and arrived at the idea of using the ancient art form of origami due to its versatility. The main challenge was to convey busy and calm through an installation without being too literal or too abstract. From research, we concluded that we needed to use a methaphor to make the data more relatable. We decided to use the metaphor of a blooming flower that takes up space. Flowers are a familiar symbol for the citizen of Hilversum, where nature is listed as one of the main characteristics of the city.
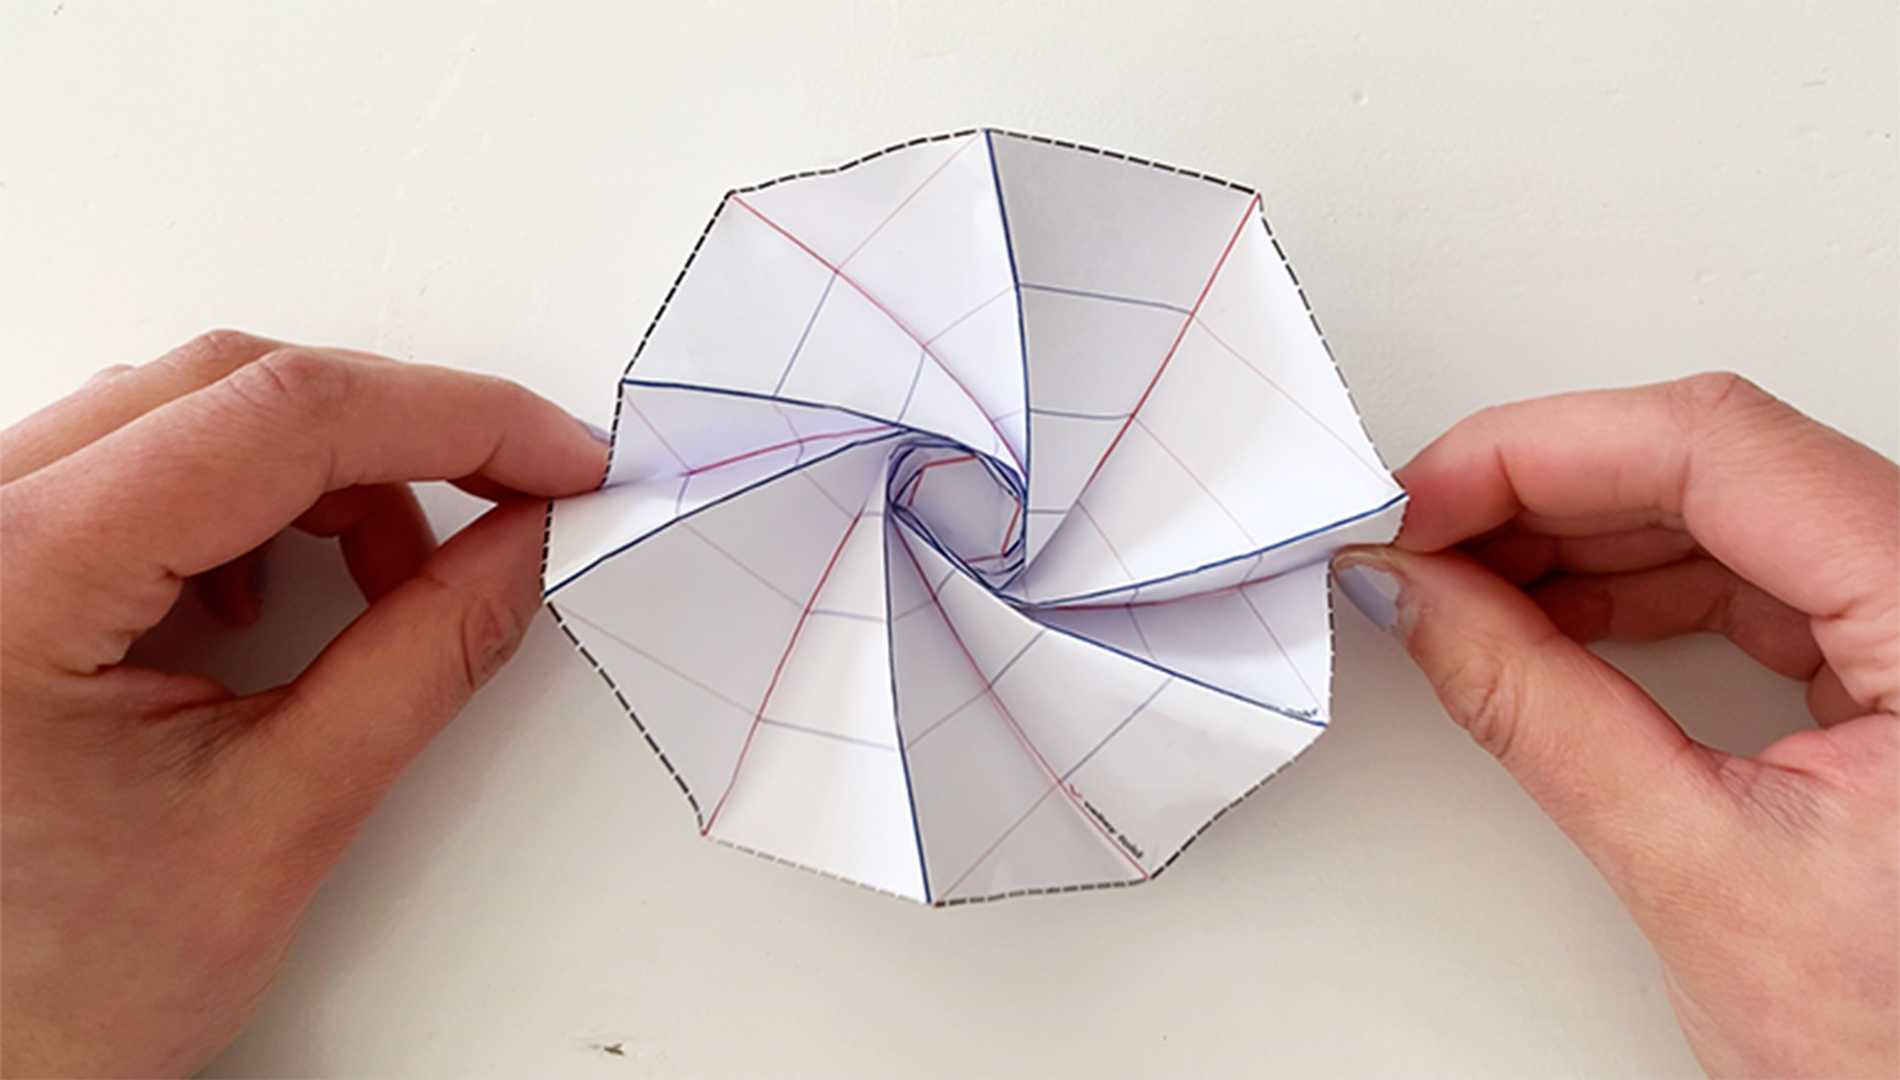
After an exploration of origami forms and user testing, we arrived at this flower shape.
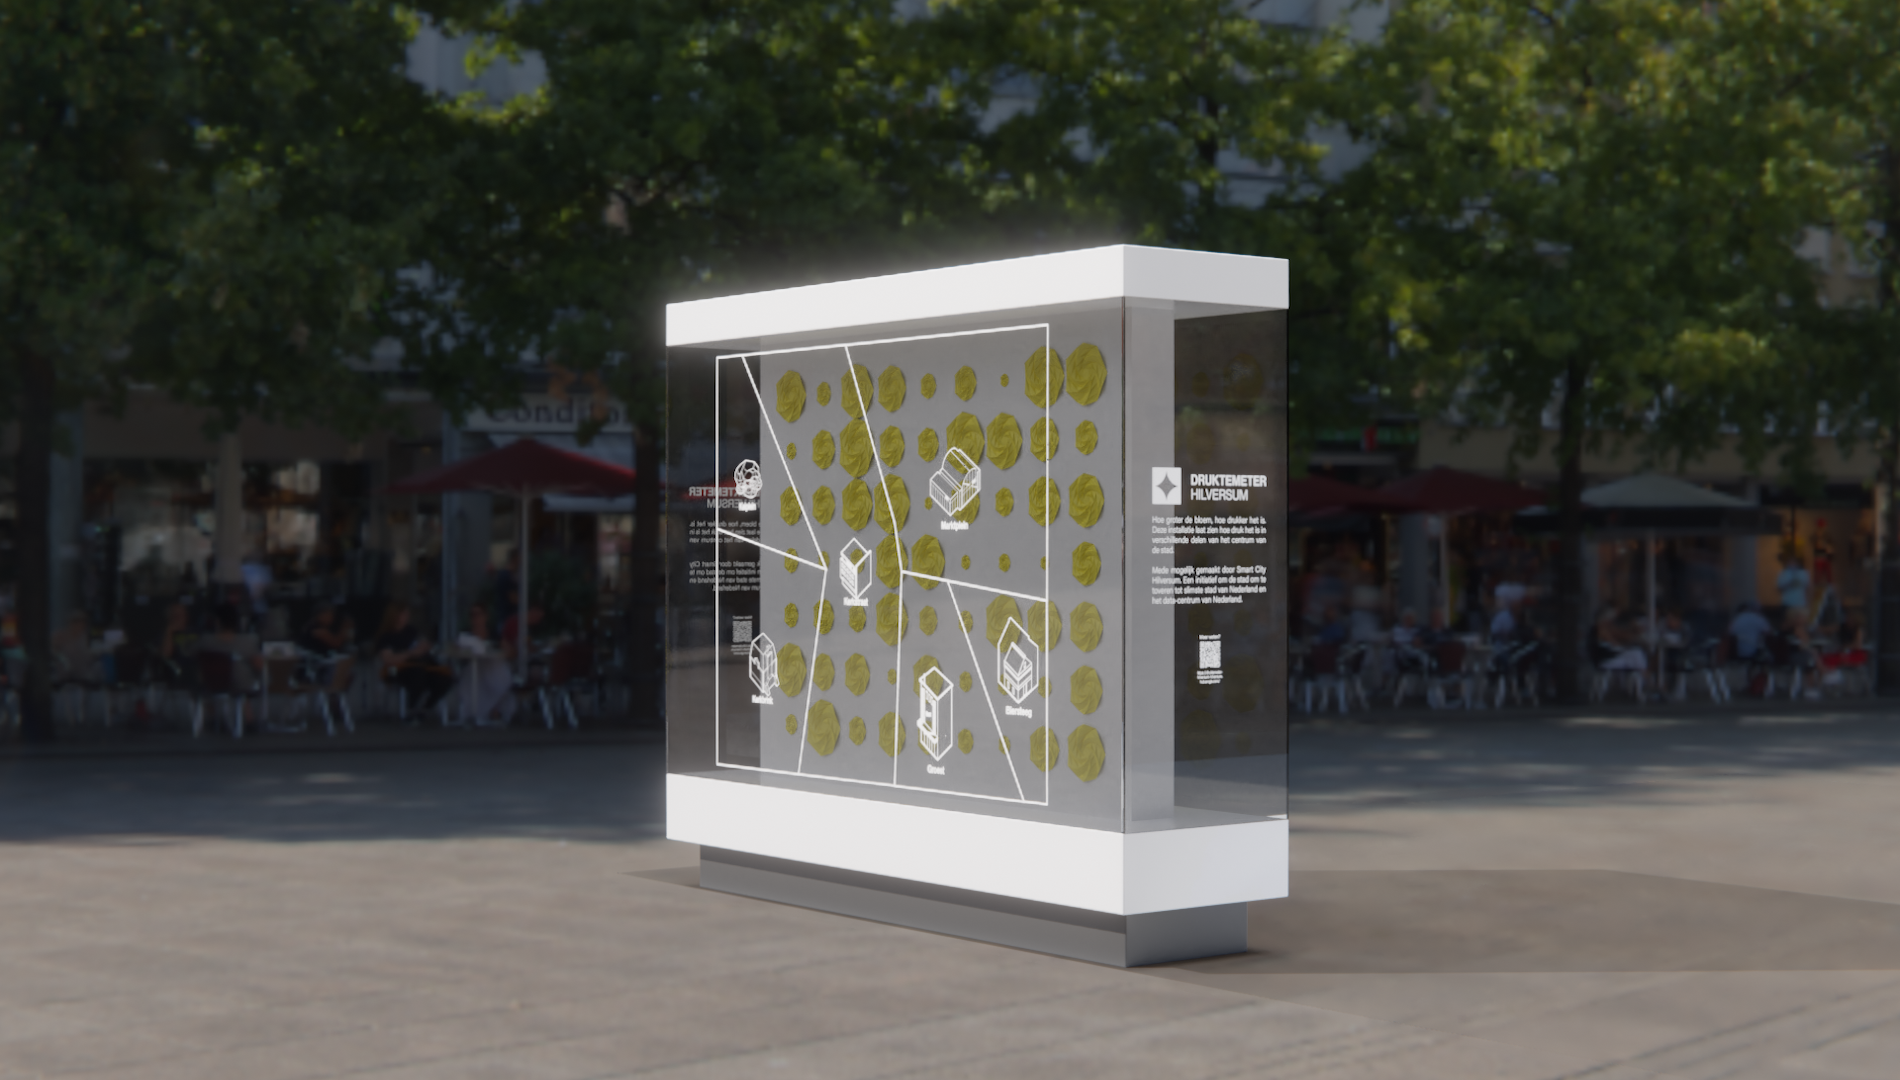
The origami flower is connected to a mechanism that makes it open and close based on the received live data - the busier a certain area of the city centre is, the more the flowers in that area of the installation opens up.
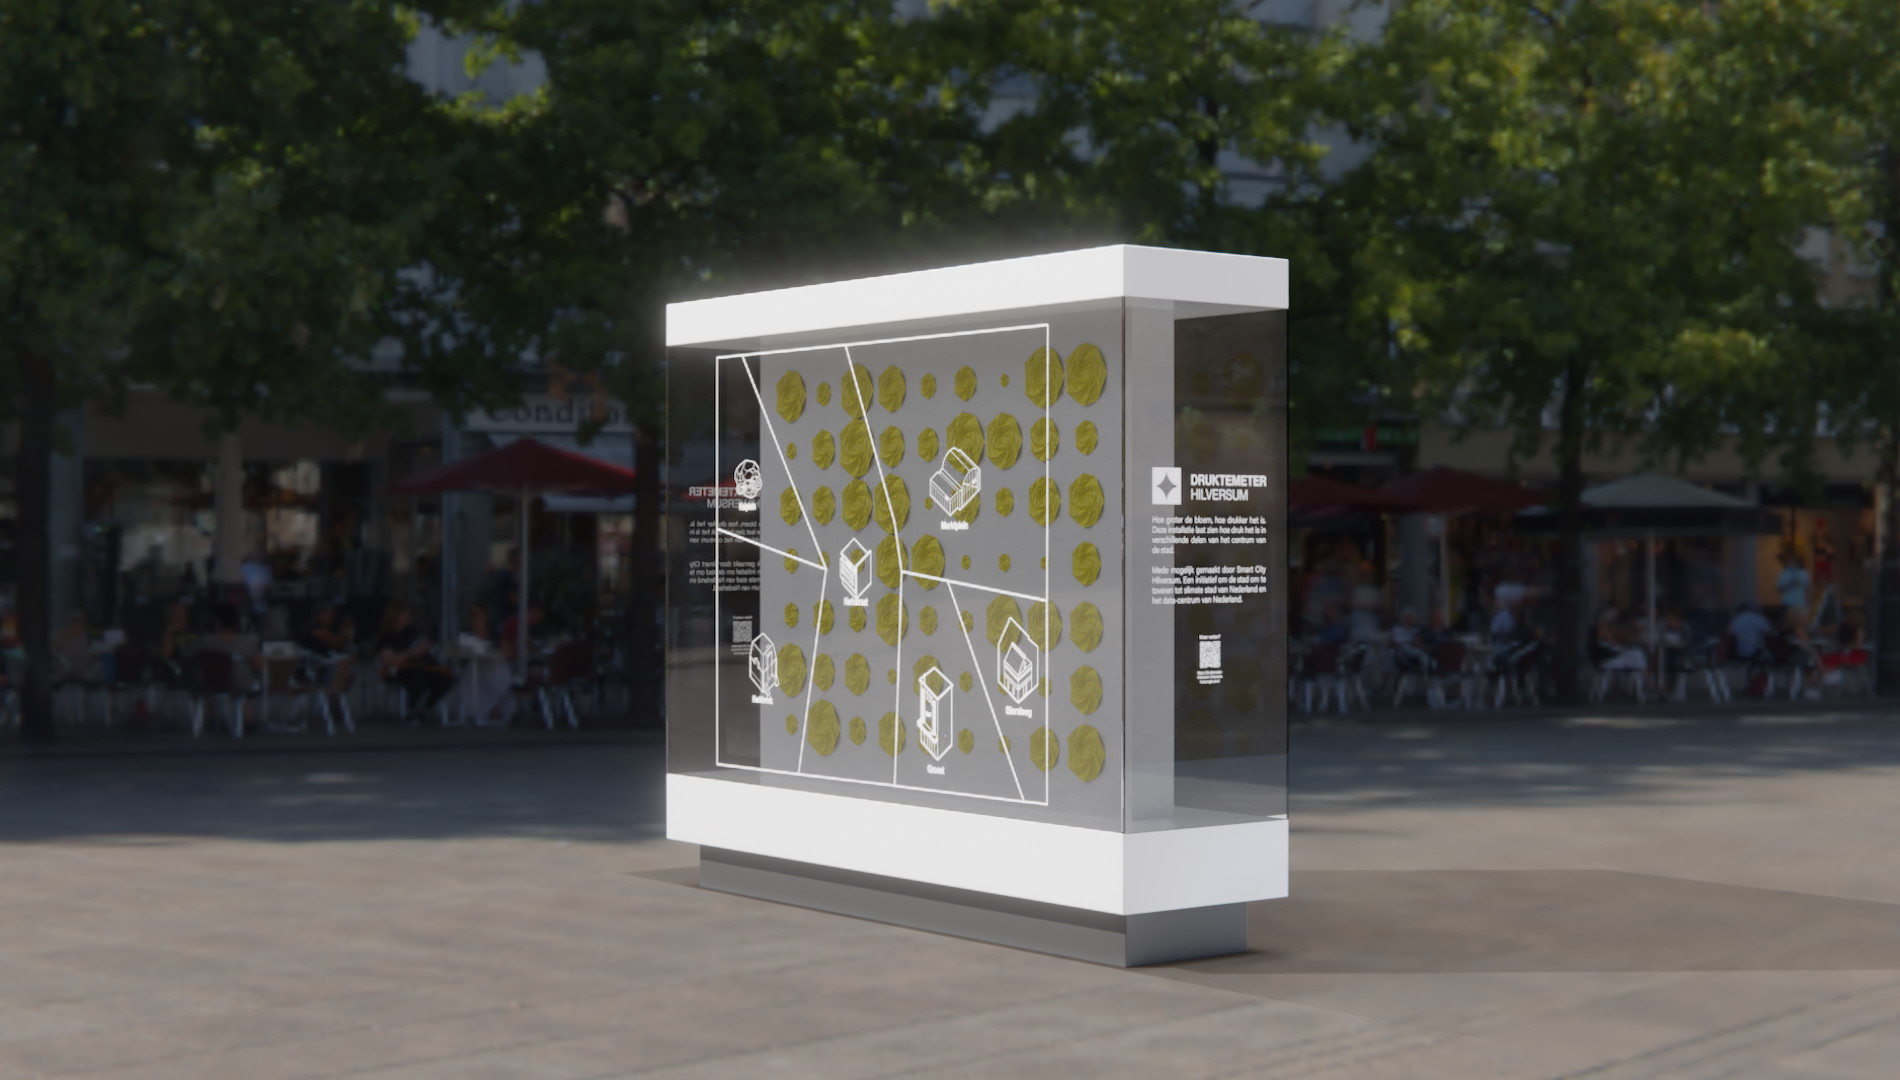
It is placed in a strategic point, Kerkbrink square, a meeting point between pedestrians and people transiting the city by bike, public transport or car. Anyone passing through Kerkbrink square can see how busy any of the central areas of Hilversum is and decide where they want to go.
The physical installation came as a solution for a user journey taking place in the city centre of Hilversum. However, we also have in mind people that would prefer to check this service before they head out. For this reason, we created a digital medium and translated the physical installation into an adaptable design language.
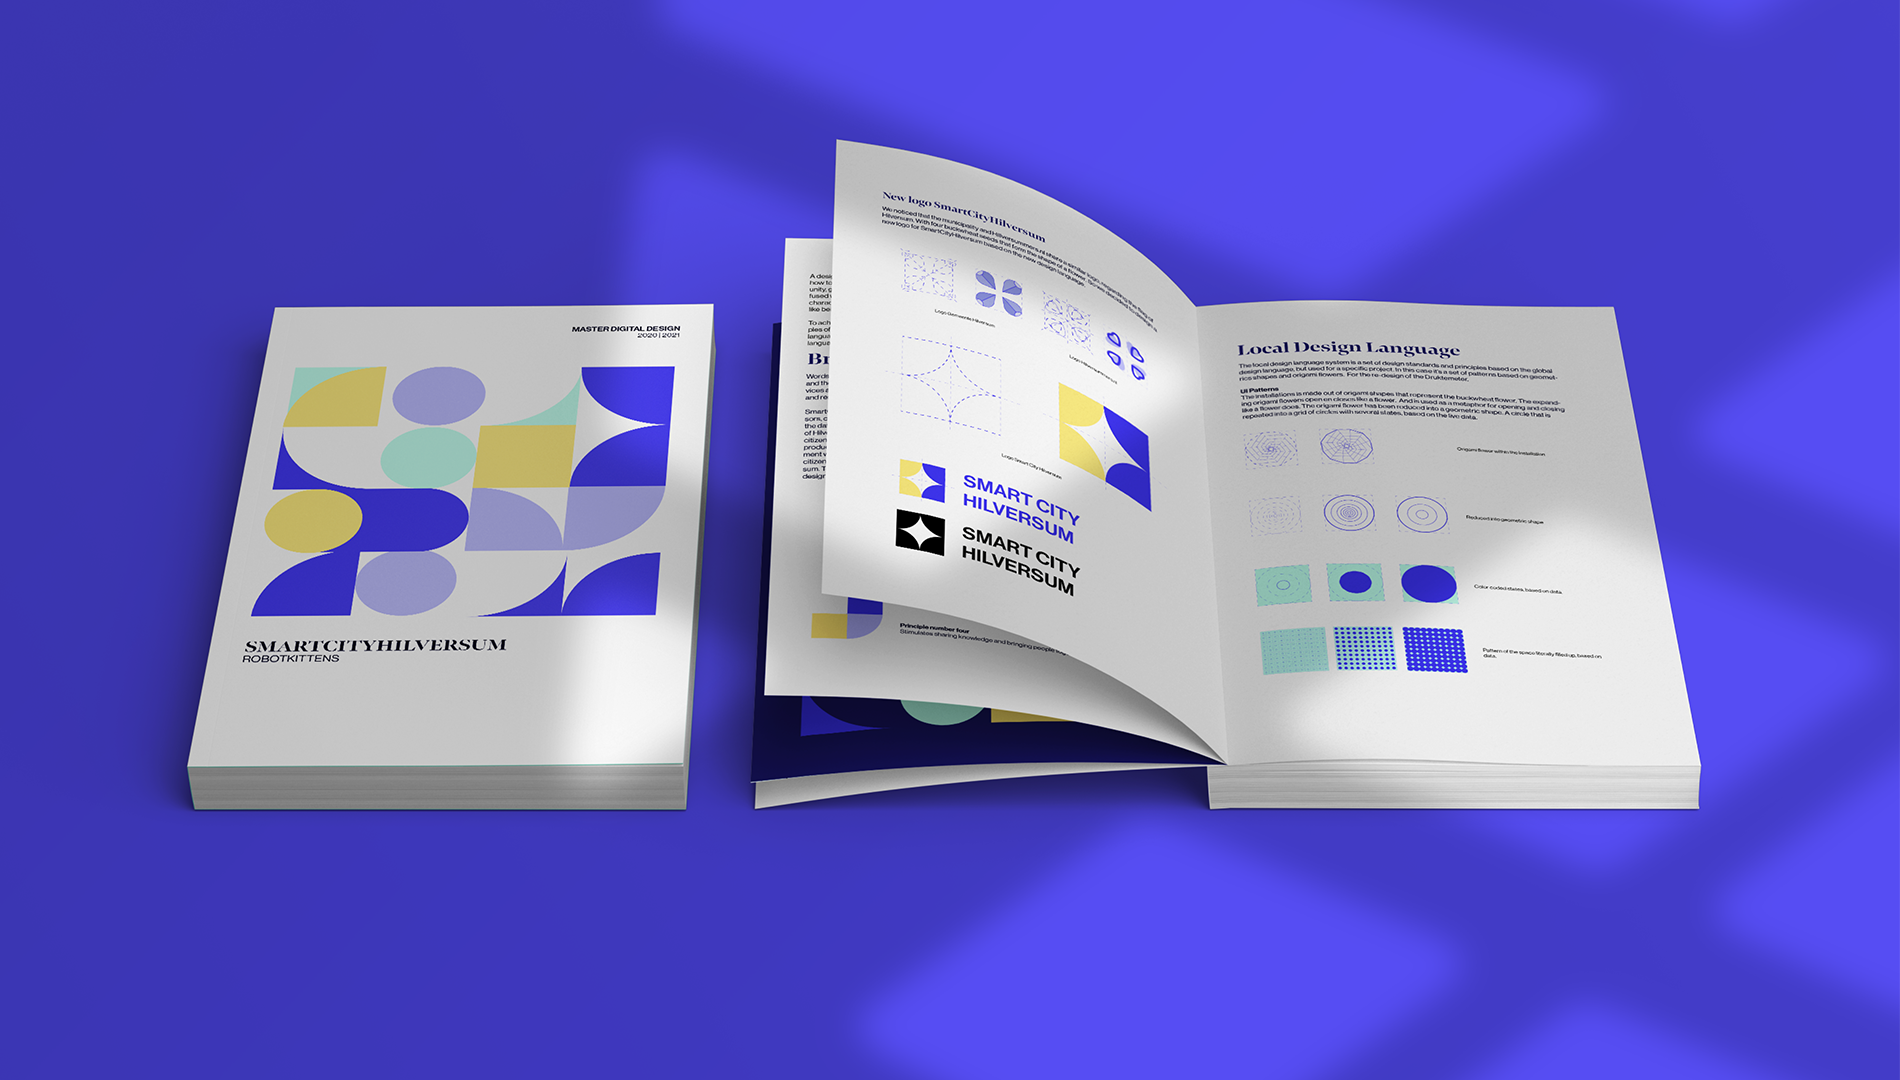
To heighten the level of harmony in both digital and physical ecosystems, we created a full-fletched design language for SmartCityHilversum. The design language, we based on their core principles and will create unity in their brand and within future projects, thereby more presence in the city.
An ecosystem of products
Our whole concept became an ecosystem of products within the customer journey of citizens:
- an installation for first encounters;
- the Web App for daily use;
- campaigns to familiarize them with the products
- Design language to create unity
Our team envisions future scenarios where the Web App might also be useful for tourists, events in the city centre or for the police to use during club hours, making the Druktemeter service even more valuable in the future.
Watch the video about our research into the Druktemeter